
Bearish Momentum
June 13th, 2022
Macro Commentary
Key Takeaways
- The reality of a recessionary inevitability has begun to be digested
- CPI continues to rise, signaling potential aggressive Fed action this week
- Treasury yields also continue to spike higher with rising oil prices
The question of will there be a recession has now transitioned to when, and for how long. Last week's Consumer Price Index year-over-year reading of 8.6%, higher than 8.3% last month, surprised investors on the possible magnitude inflation has risen so far with not enough response from the Fed to date. Core CPI, which excludes energy and food, improved slightly to 6%, from 6.2%, but the general month-over-month CPI reading rose to 1% from 0.3% last month. The Fed and investors could be experiencing a little more turbulence ahead as persistent inflationary indications prompt a faster and more aggressive response from the Fed. What seemed like only two 50 basis point hikes planned for June and July, has now spilled over to a more probable third in September, so far, with questions if 50 basis points is enough to make a dent in curbing inflation readings. FOMC meets this week with their decision due Wednesday afternoon.
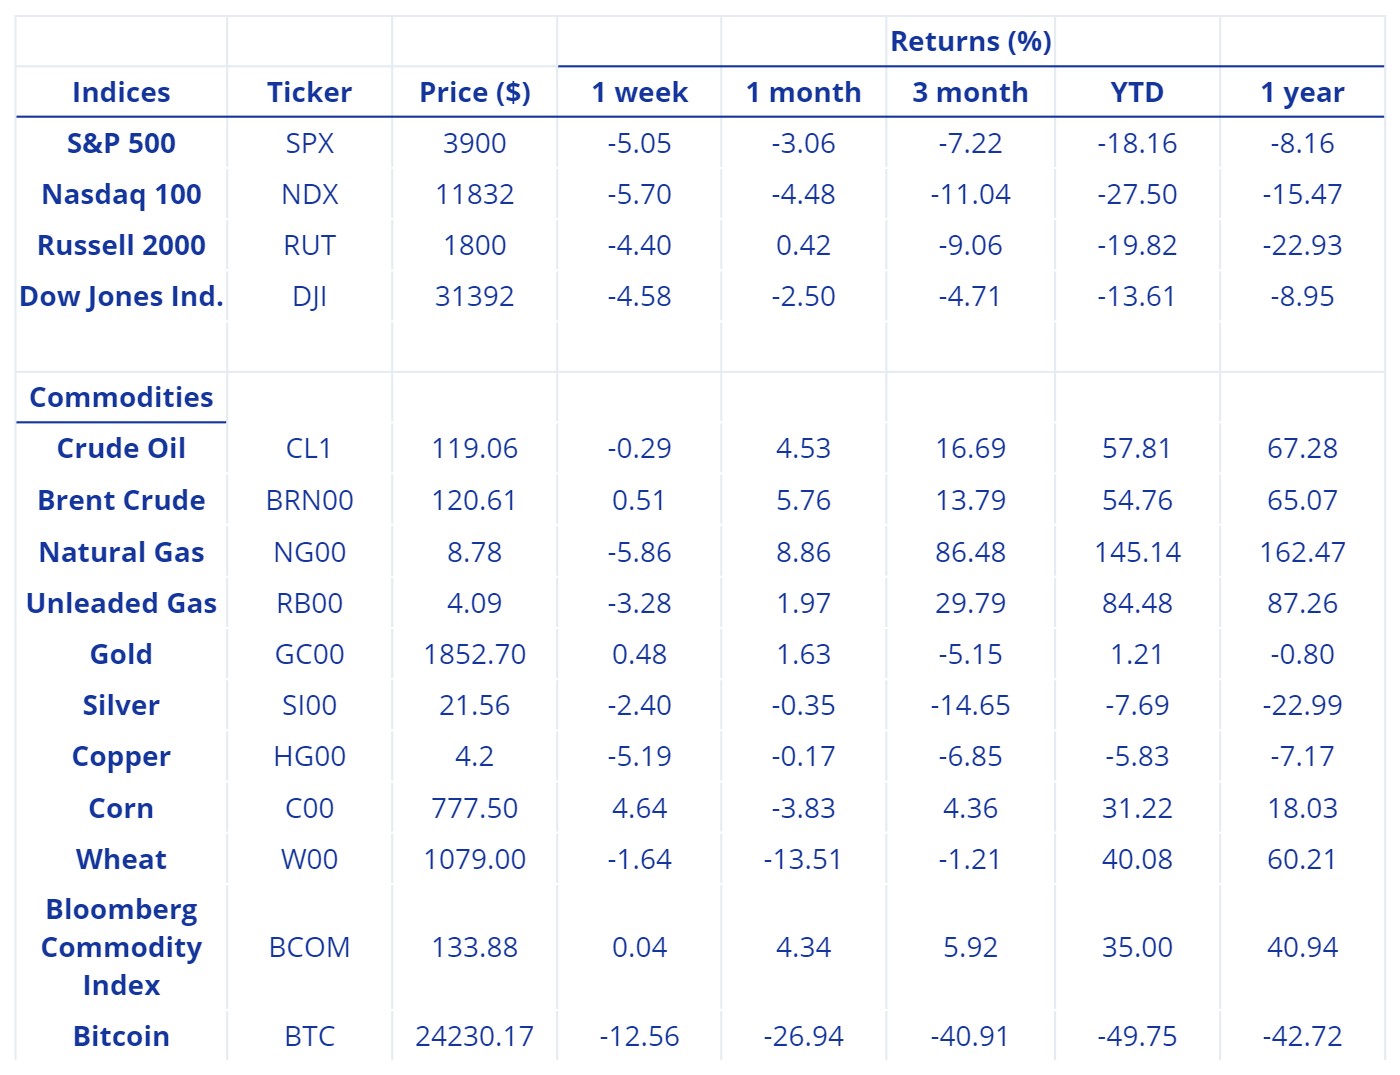
Markets opened Monday in correction territory with the S&P 500 index trading around the 3,800 level, a little over 20% down for the year. Nasdaq Composite is now down over 30% down for the year trading below the 11,000 level. As expected, the yield curve exploded with the rates moving higher after the CPI release. The 10-year Treasury yield crossed over the 3.3% level which was last reached in mid-2011. The front end of the curve rose notably with the 2-year yield at 3.24% Monday morning, causing the 2/10 treasury yield spread to decline to almost even from about +30 basis points last week, before rising to about +10 basis points midday Monday. Crude oil futures traded in a tight range last week, $120 to $124 a barrel. Normal summer demand can make vacation travel a little higher than usual.
The Fed will likely have one more data point, the Producers Price Index, released before FOMC. Thursday's data release includes the Initial Jobless Claims currently expected to be 217k, down from last week's 229k reading, which was higher than the week prior. These levels are still at historical lows and could help measure the economy's employment picture.
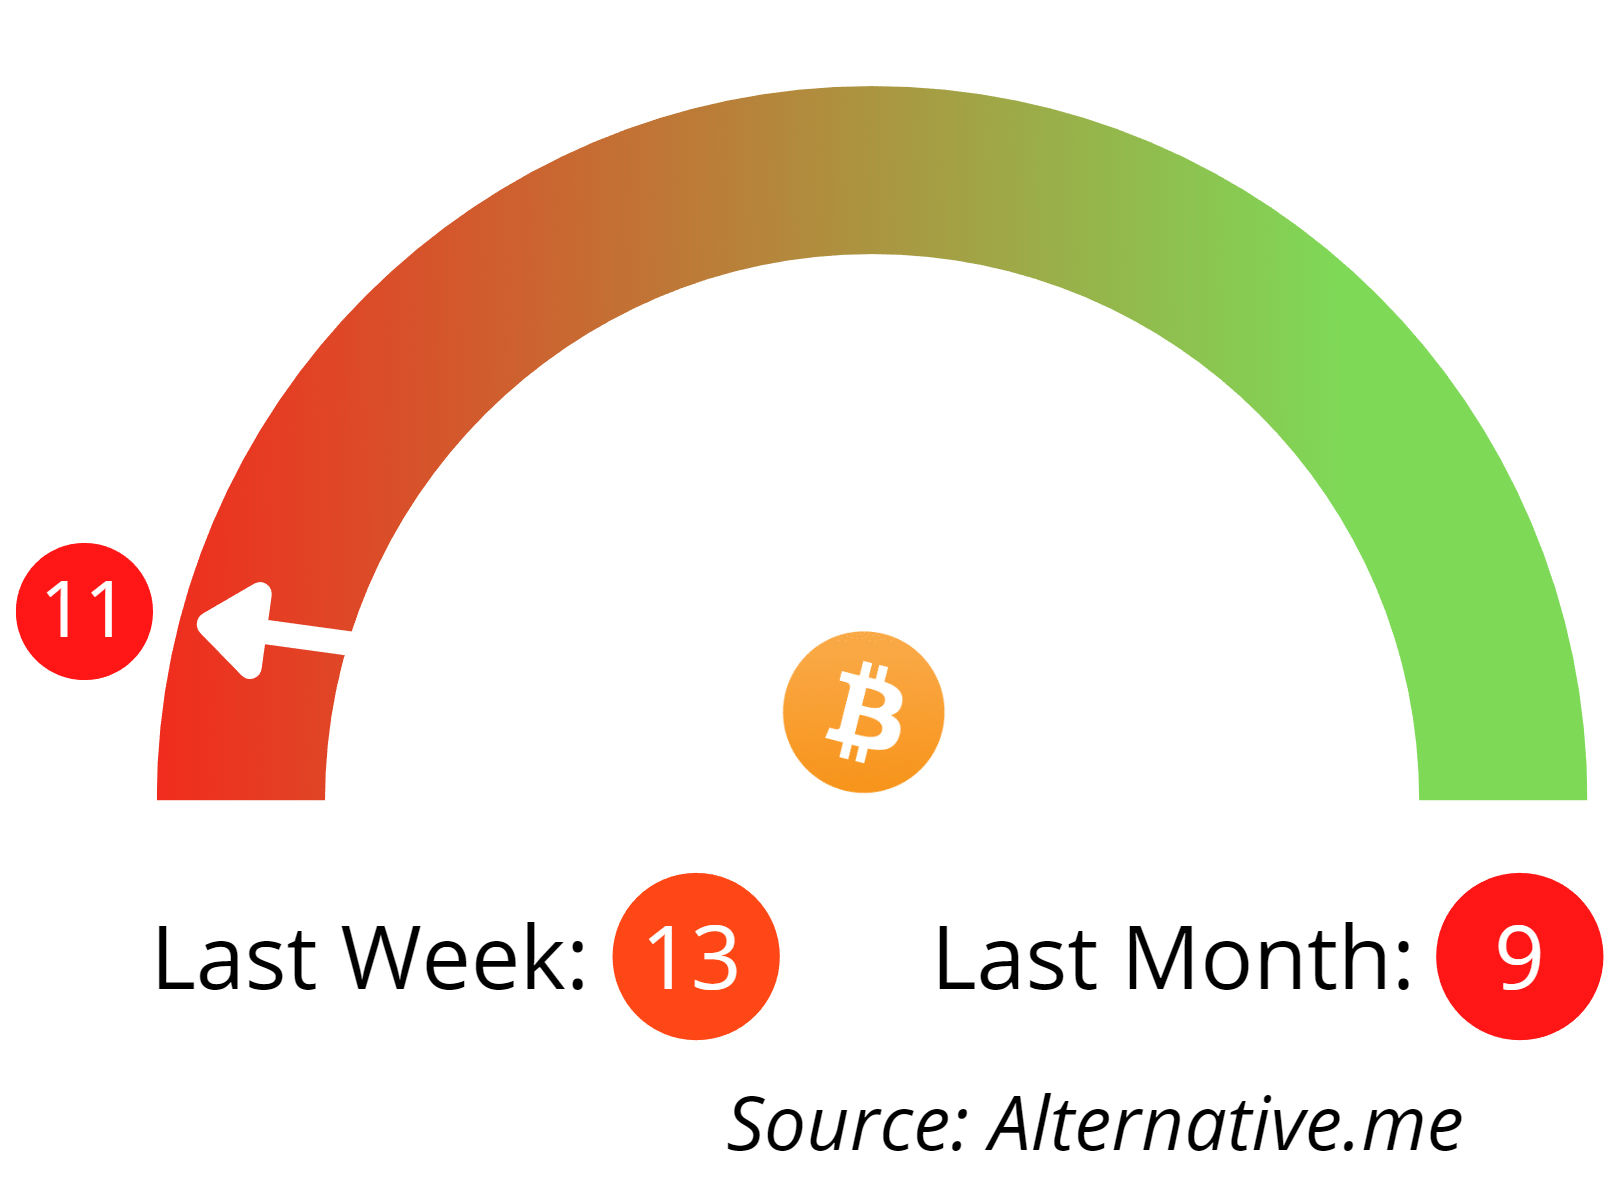
Bitcoin Fear and Greed Index
Multifactorial Market Sentiment Analysis
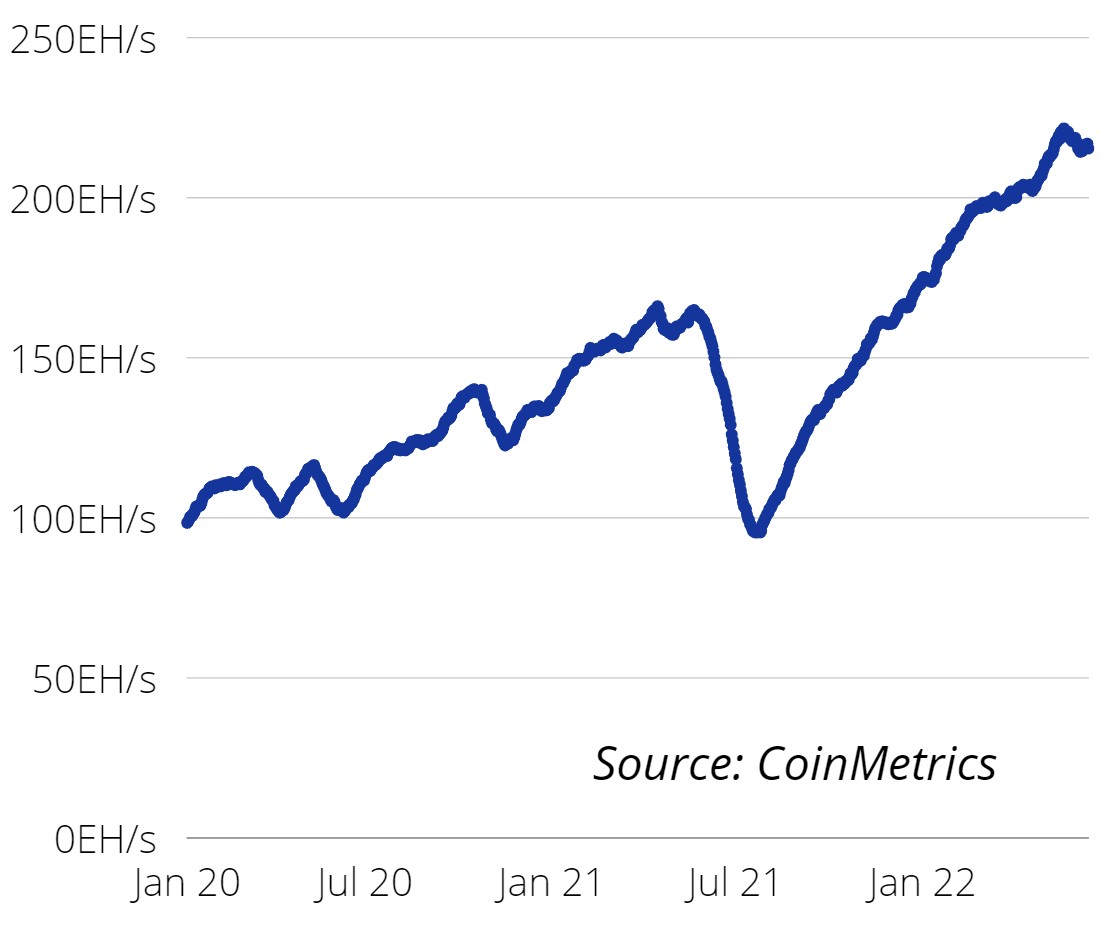
Bitcoin Monthly Average Hashrate
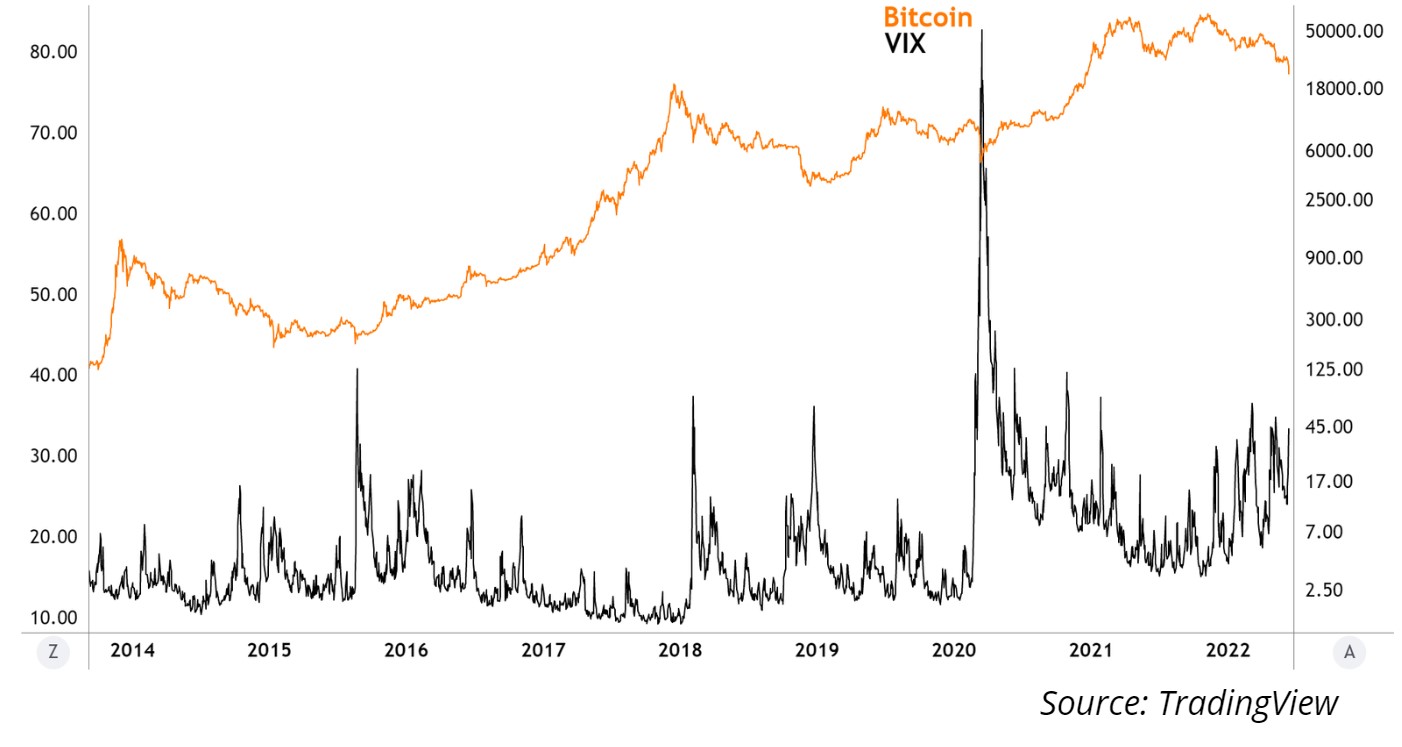
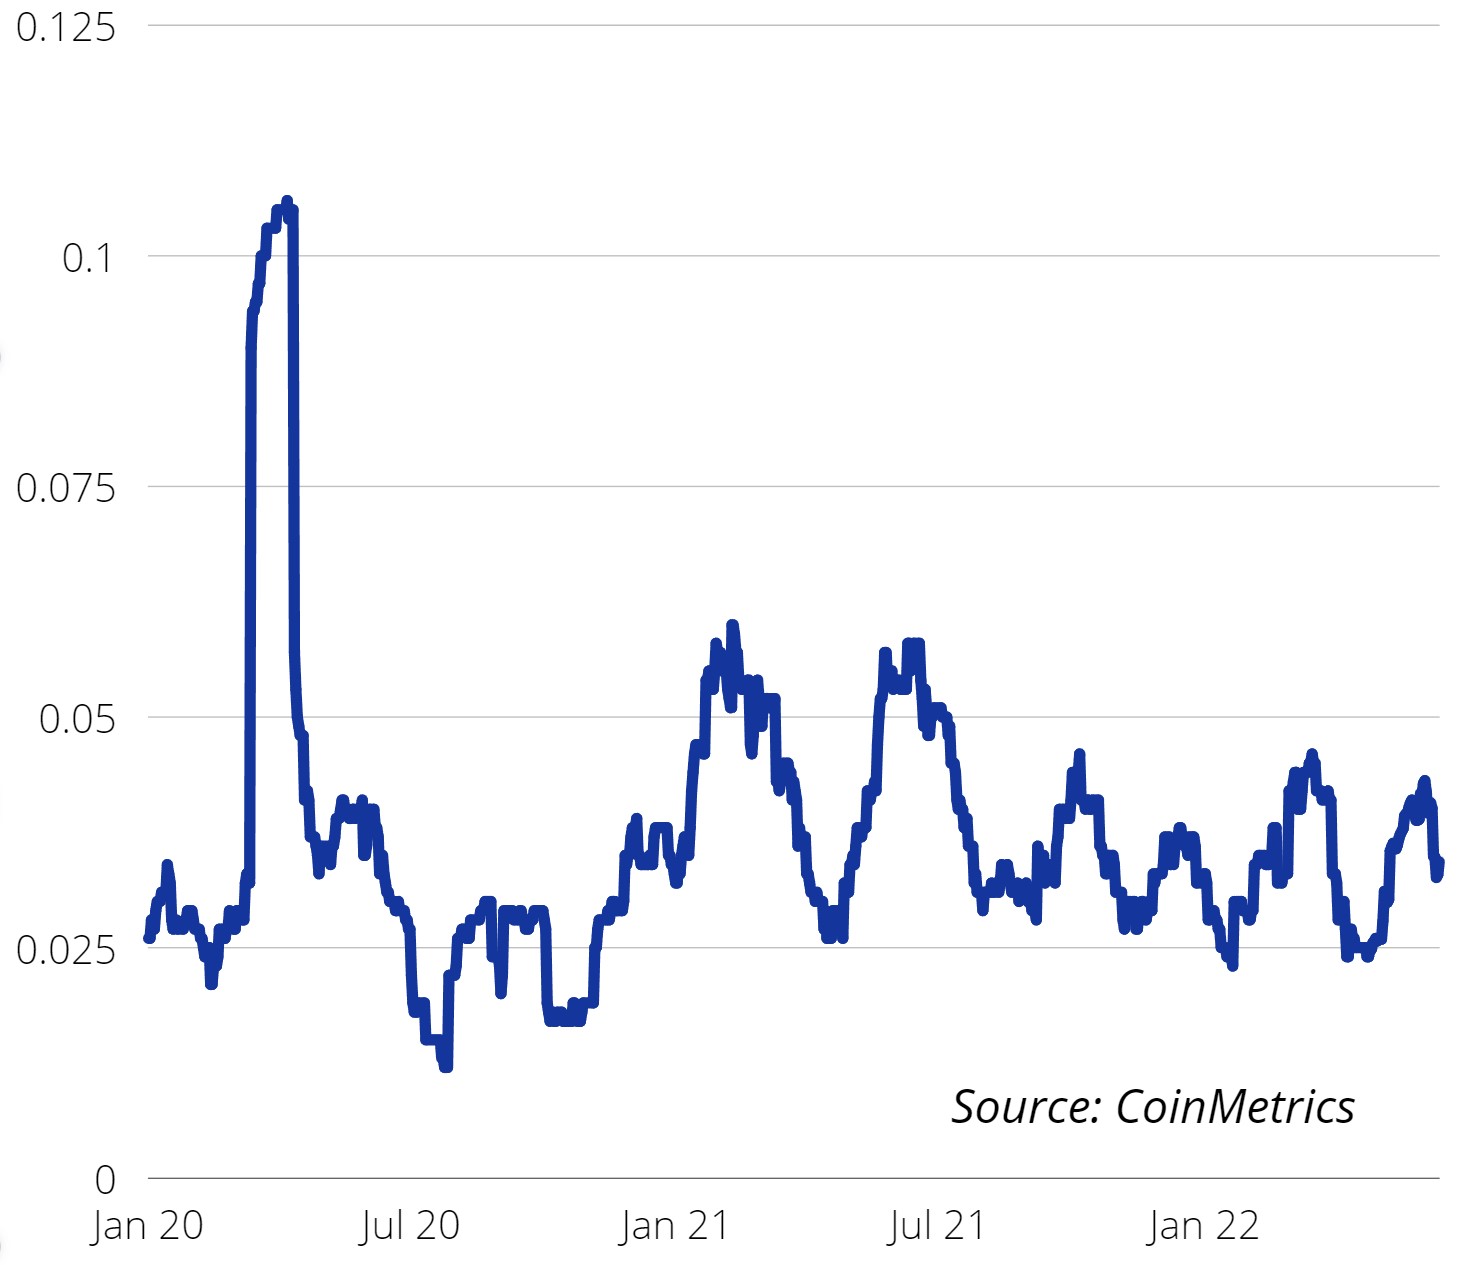
Bitcoin 30-Day Rolling Volatility
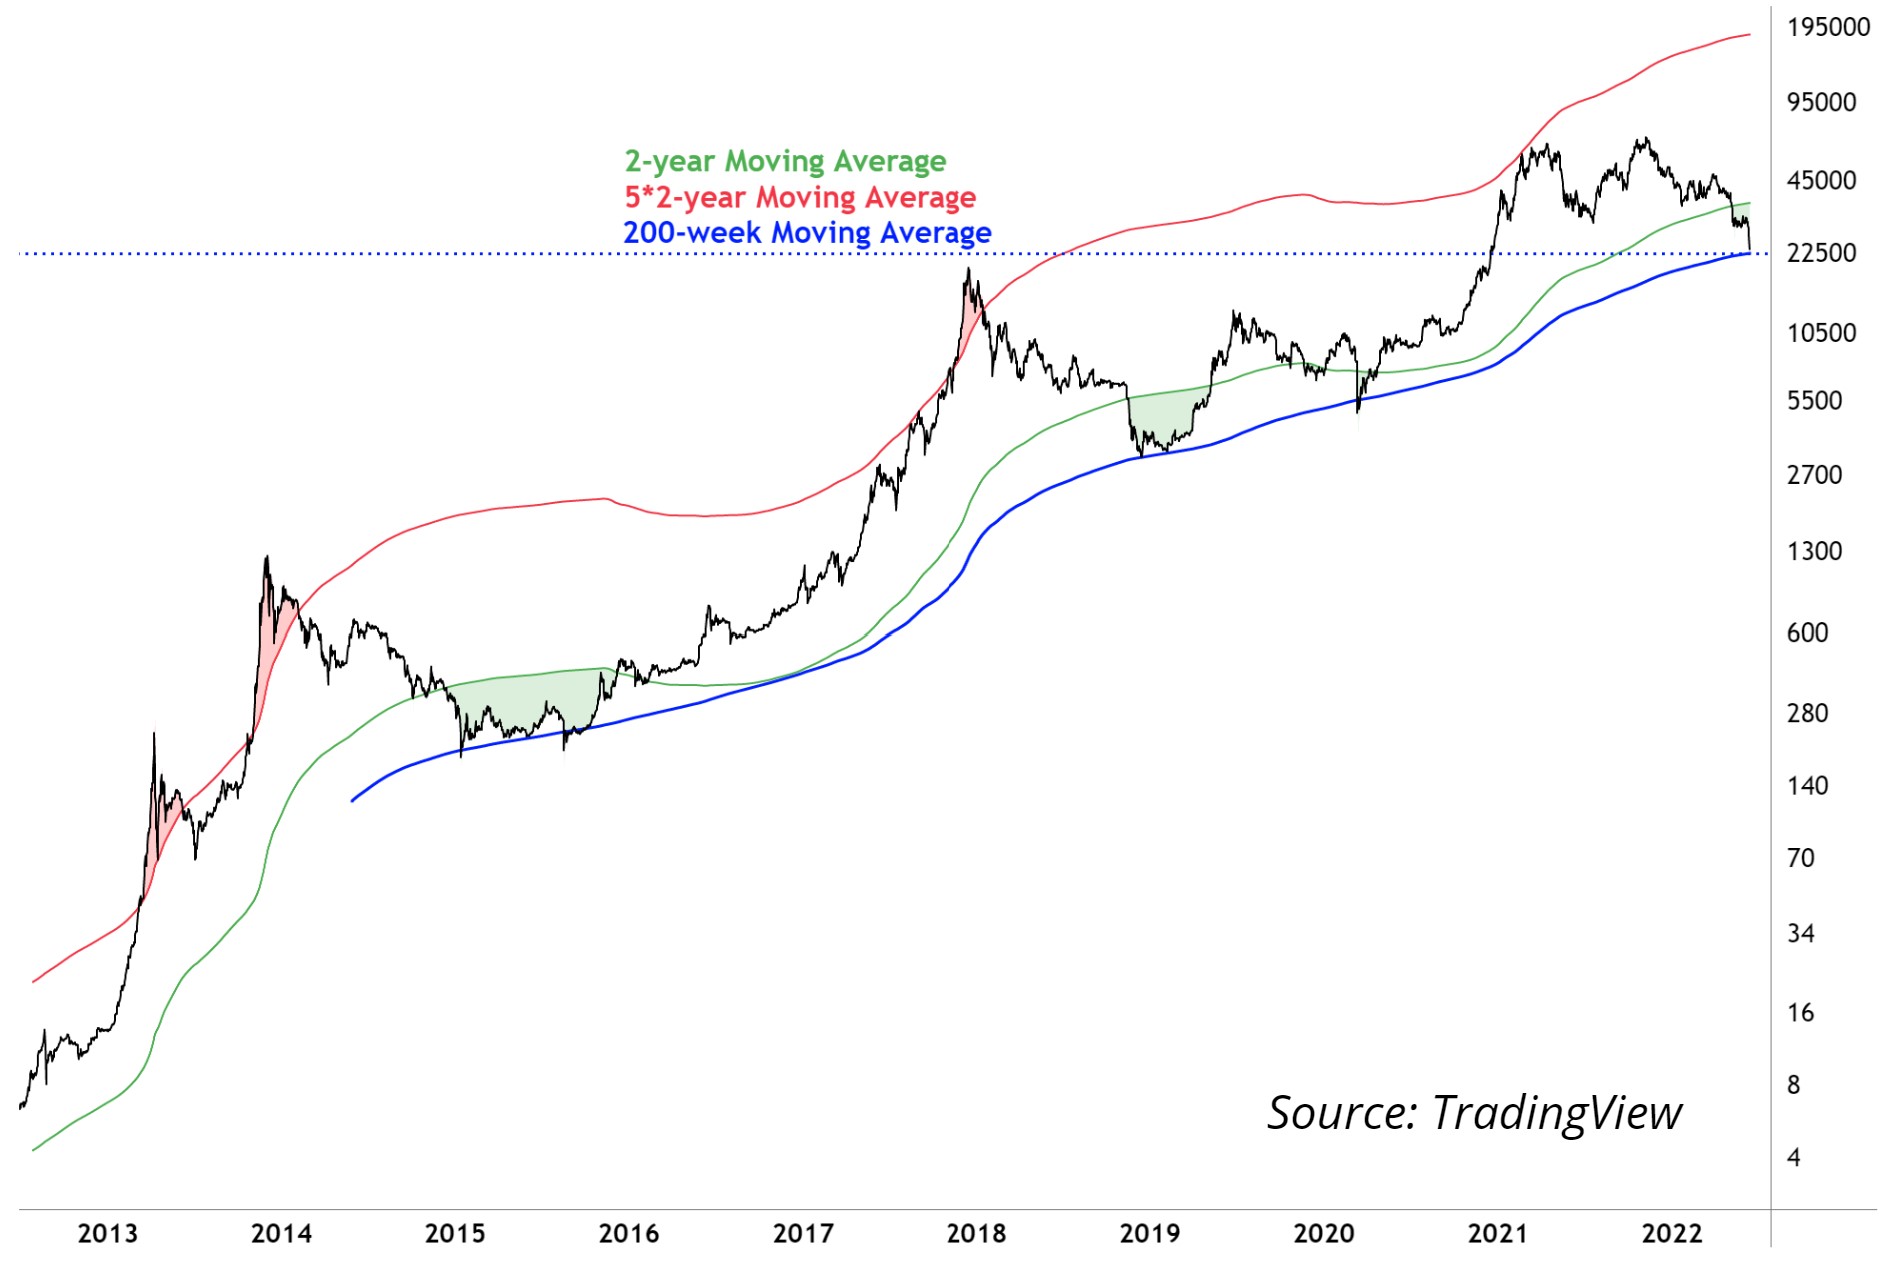
Bitcoin Moving Averages
On Chain Commentary
Key Takeaways
- Digital assets and traditional finance extend bearish momentum
- Concerns around crypto lender Celsius have added fuel to the bearish fire
- Technicals for both Bitcoin and Ethereum show prices reaching key levels
Digital assets and traditional finance continue to hold both a bearish stance and strong correlations. Over the past few days, this bearishness has been accelerated in digital assets by potential concerns over illiquidity and insolvency for cryptocurrency lending platform Celsius. In the chase for yield, Celsius has been entangled with DeFi obligations they currently have trouble unwinding, based on on-chain evidence. This led to a decision to halt withdrawals late Sunday night, which brought additional market panic. Clarity surrounding Celsius’ debts and obligations will likely continue to emerge in the coming days.
On a technical basis, Bitcoin has now reached the 200-week moving average at $22,000, thanks in part to the associated forced selling regarding Celsius. Additionally, Bitcoin’s realized price or aggregate average price of all coins moved on-chain, sits at $23,000. Historically, both the 200-week moving average and the realized price have acted as an accumulation zone for market participants in prior bear markets. Bitcoin’s weekly Relative Strength Index (RSI) is also currently sitting at or near all-time lows. The technicals for Ethereum also mimic those of Bitcoin; at or near both the 200-week moving average and realized price, with historically low weekly RSI.
News Review
- New York’s Crypto Regulator Publishes Formal Stablecoin Guidance
- PayPal Lets Users Transfer Bitcoin and Ethereum to External Wallets
- Fireblocks Deepens Payments Push With Checkout.com USDC Settlement
- Goldman Sachs Executes Its First Trade of Ether-Linked Derivative: Report
- Citadel Securities Is Building a Crypto Trading Marketplace With Virtu Financial: Sources
- Crypto Exchange Bitstamp Launches Earn Product for Ethereum, Algorand in US
- A decade after the bubble burst, 5 climate tech investors explain why they’re all in
- Binance US Launches High-Yield Crypto Staking for Solana, Avalanche and More
- Ethereum Core Devs Delay Crucial 'Difficulty Bomb' for Two Months
- Bloomberg Empowers Clients by Expanding Coverage to Top 50 Crypto Assets
- Bitcoin Infrastructure Provider Mash Closes $6 Million Seed Round
- Circle to acquire crypto infrastructure startup Cybavo
- Jack Dorsey's Bitcoin venture TBD unveils proposal for decentralized Web platform
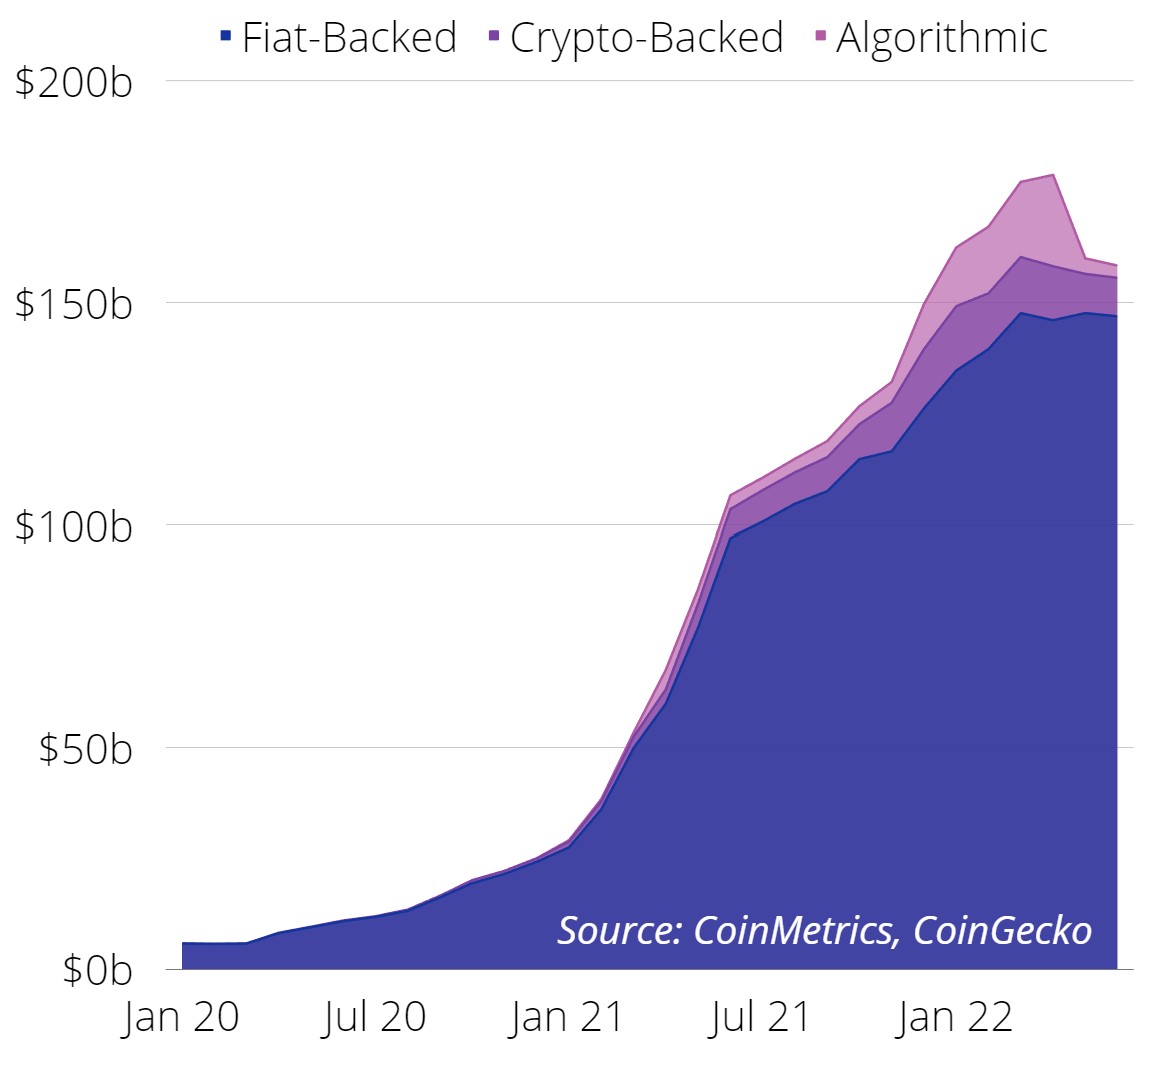
Stablecoin Circulating Supply
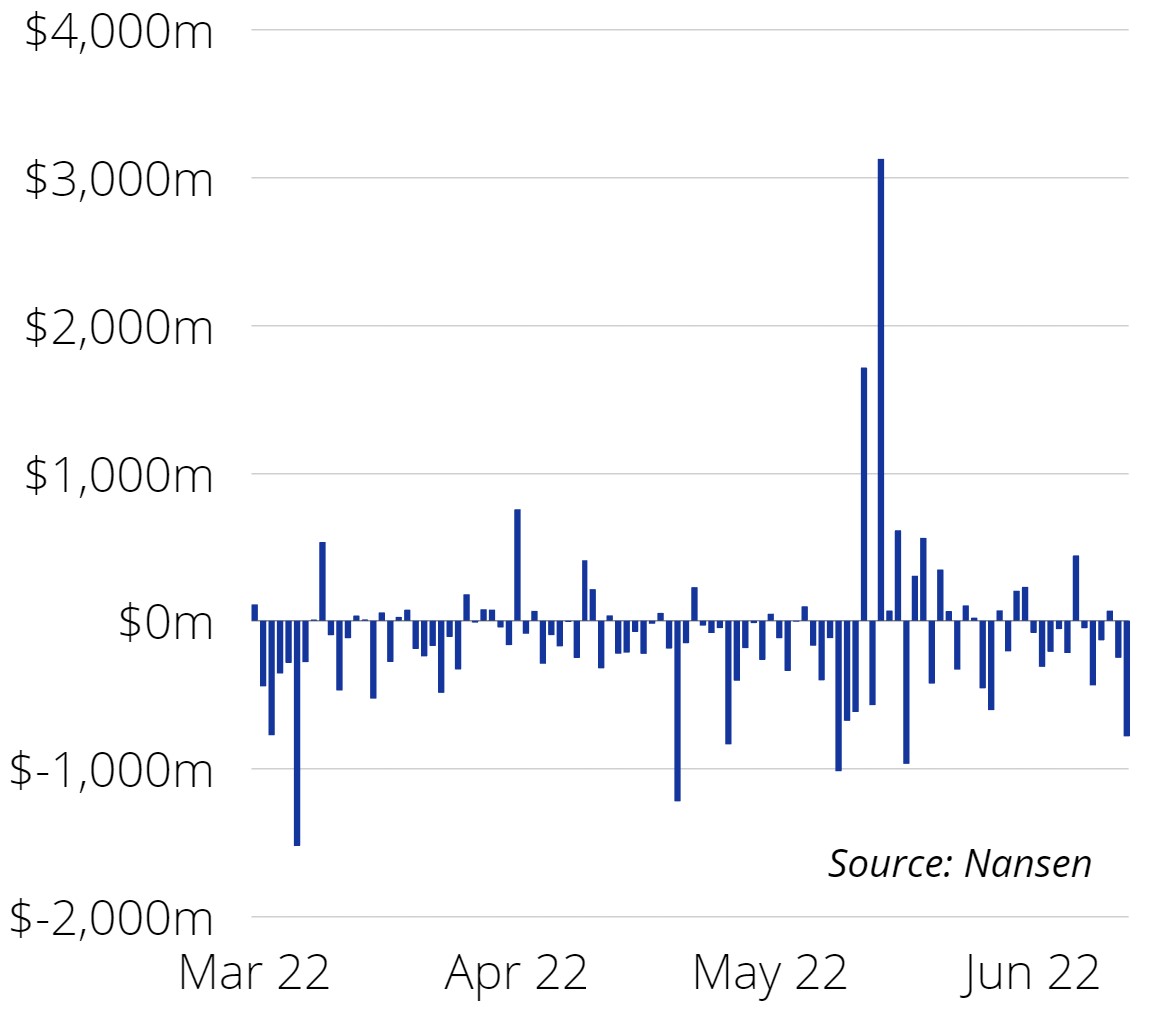
Stablecoin Net Exchange Flow
The Portfolio Management Team
Steven McClurg, CIO
Bill Cannon, Portfolio Manager
Wes Cowan, Portfolio Manager, Head of Defi
Josh Olszewicz, Head of Research
Sean Rooney, VP Research and Trading
Will McDonough, Vice Chairman, Investment Committee
Leah Wald, CEO, Investment Committee
Shannon Smith, Head of Investor Relations
Weekly Thoughts: Source: Valkyrie Investments, Inc.
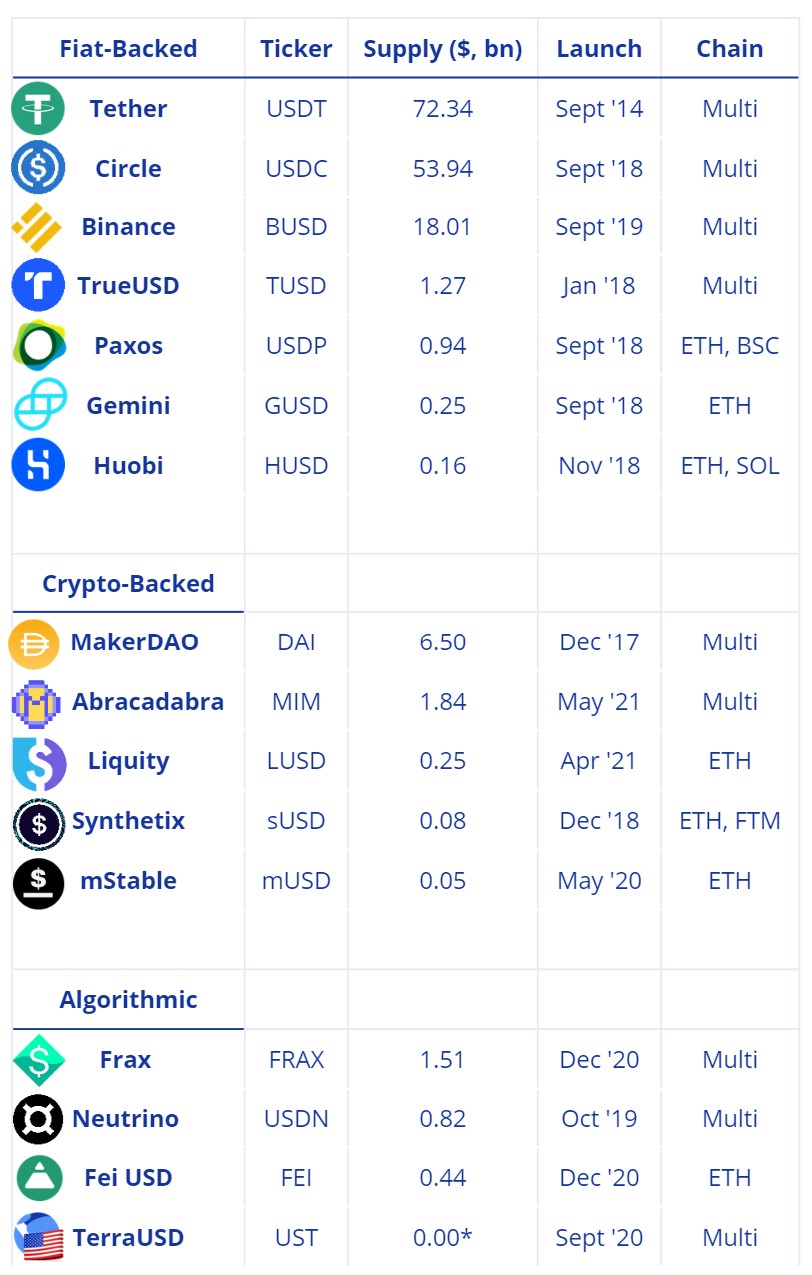
Stablecoin Origins & Purpose, Fiat-Backed, Crypto-Backed, Algorithmic, Terra and UST De-pegging Event: Valkyrie Investments, Inc., Tether Operations, CoinMetrics, Circle, and Paxos
Macro Commentary: Source: Valkyrie Investments, Inc.
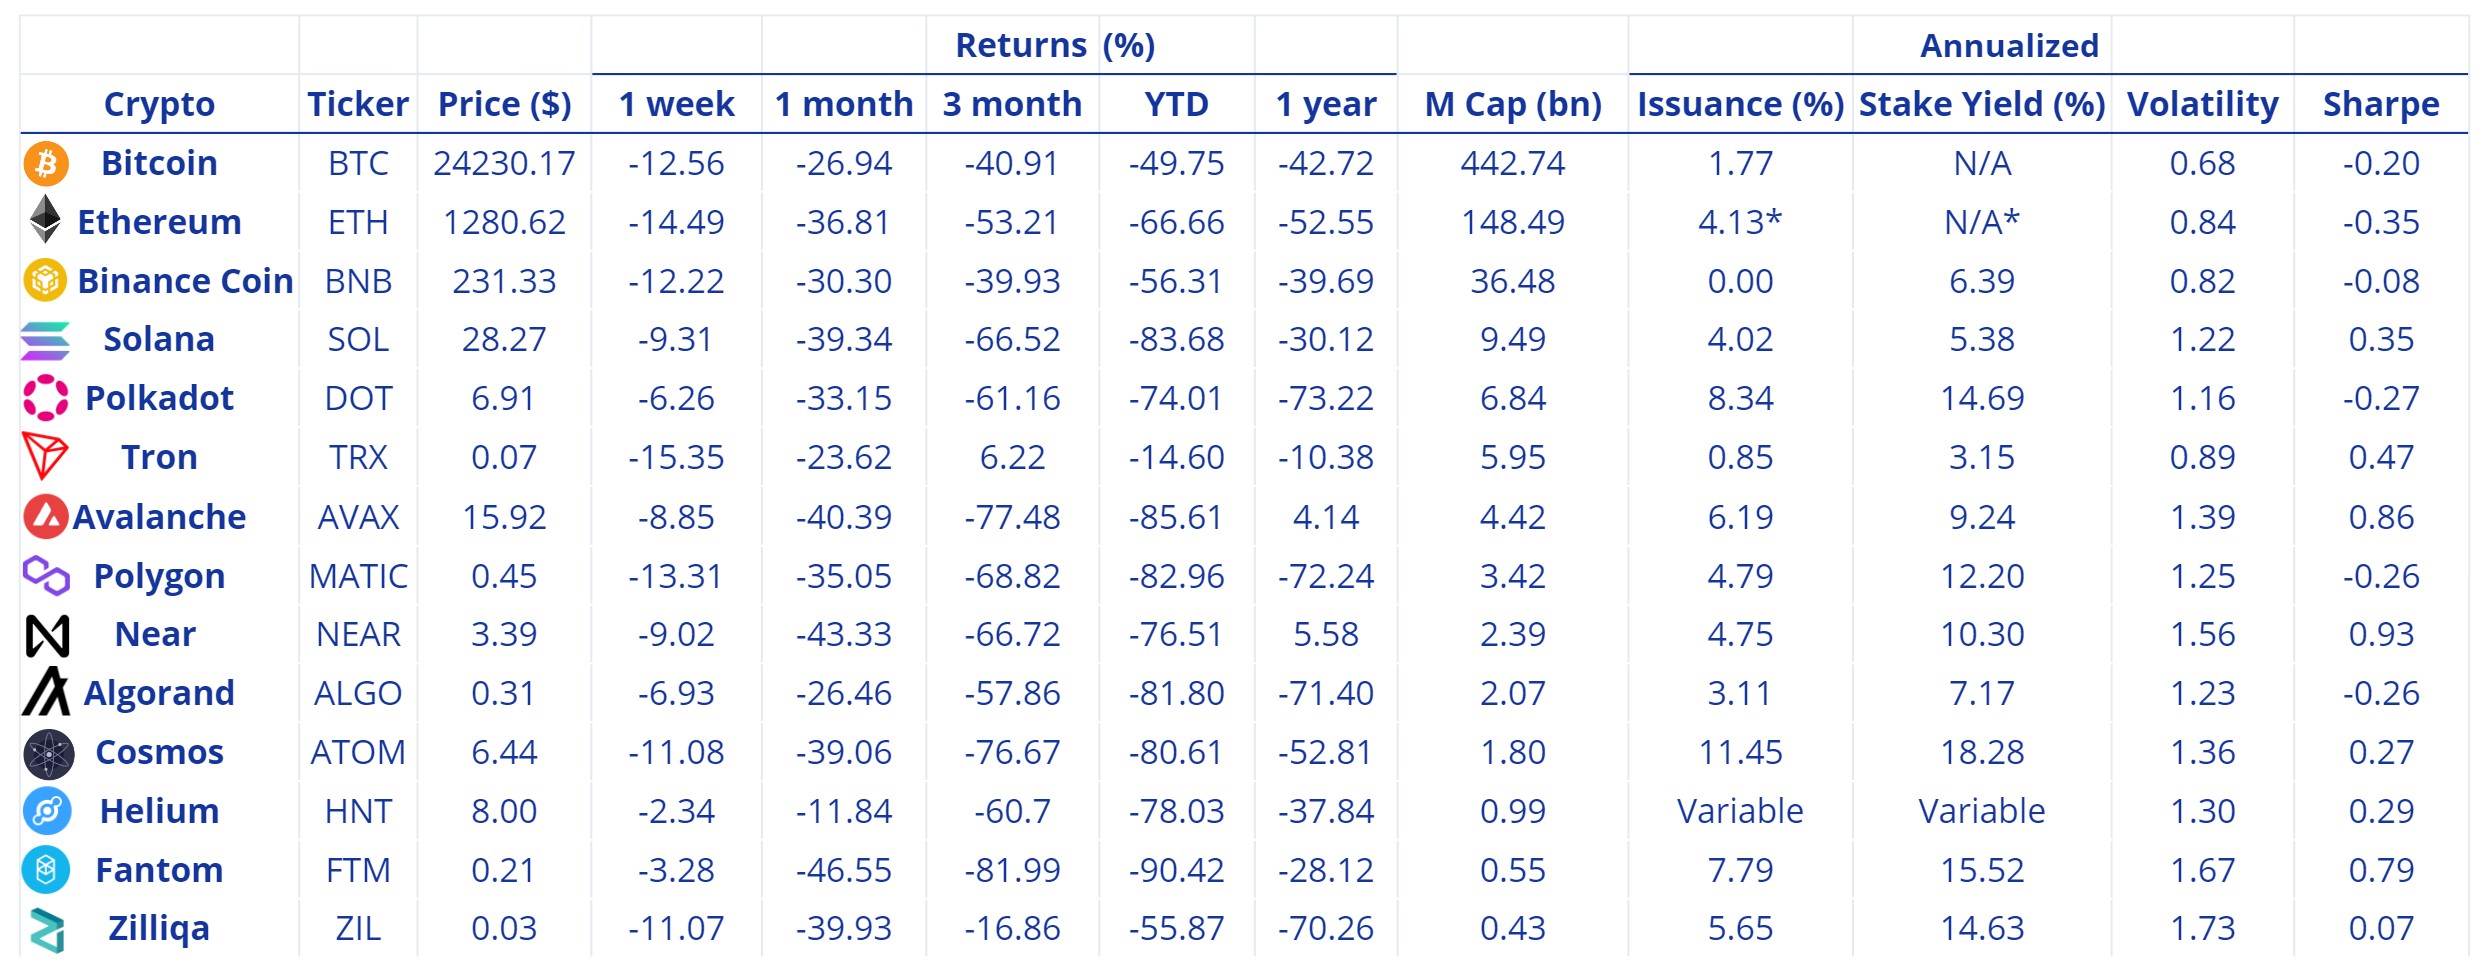
Coin Prices, Market Capitalizations, and Returns: Source: Valkyrie Investments, Inc., TradingView, Messari. All returns represent total return for stated period. Coin Logos: Source: cryptologos.cc
Annualized Issuance, Staking Yield, Volatility, and Sharpe Ratio: Source: Valkyrie Investments, Inc., Messari, StakingRewards.com. *ETH's EIP-1559 token burn and ETH-2 staking not included.
Bitcoin Fear and Greed Index Source: Valkyrie Investments, Inc., alternative.me and represents a multifactorial sentiment analysis index of volatility, market momentum and volume, social media, bitcoin market cap dominance, and Google trends
Bitcoin Monthly Average Hashrate, Bitcoin 30-Day Rolling Volatility: Source: Valkyrie Investments, Inc., CoinMetrics
Bitcoin Weekly Moving Averages: Source: Valkyrie Investments, Inc., TradingView - INDEX:BTCUSD
Stablecoin Circulating Supply: Source: Valkyrie Investments, CoinMetrics, The Block, and CoinGecko
Stablecoin Net Exchange Flow: Source: Valkyrie Investments, Inc., Nansen and represent wallet inflows and outflows of Tether, USD Coin, Binance USD, PAX, and Huobi USD through crypto exchanges, including but not limited to; Binance, Curve.fi, AnySwap, Crypto.com, Uniswap, Hop Protocol, OKEx, Kucoin, dYdX, Coinbase, Kraken, Huobi, FTX, Gemini, FTX US, CoinList, SushiSwap, Gate.io, Balancer, BitMEX, Bitfinex, Bittrex, Binance US, Bitstamp, BlockFi, Paxos, Celsius, Alameda OTC, Poloniex, HitBTC, Bancor, Kyber, and ShibaSwap.
List and examples shown in the Stablecoin table are non-exhaustive, intended for illustrative purposes only. Chain data sourced from CoinMarketCap. "Multi" description can include Ethereum, Solana, Binance Smart Chain, Algorand, Tron, Fantom, Polygon, Avalanche, Arbitrum, Secret, Terra, Moonriver, Velas, and Harmony. Coin Logos: Source: cryptologos.cc
"Indicies" prices and returns: Source: Valkyrie Investments, Inc., MarketWatch. "S&P 500" provided by Standard & Poor’s and is a stock market index tracking the performance of 500 large companies listed on stock exchanges in the United States, "Nasdaq 100" provided by NASDAQ OMX Group and includes 100 of the largest domestic and international non-financial companies listed on the Nasdaq Stock Market based on market capitalization. "Russell 2000" provided by FTSE Russell and is a small-cap stock market index that makes up the smallest 2,000 stocks in the Russell 3000 Index. "Dow Jones Ind." provided by S&P Dow Jones Indices and is a price-weighted measurement stock market index of 30 prominent companies listed on stock exchanges in the United States. "Gold" provided by NYMEX - CME Group and is a continuous futures product. All returns represent total return for stated period.
"Commodities" prices and returns: Source: Valkyrie Investments, Inc., Wall Street Journal. Bloomberg Commodity Index provided by Bloomberg and tracks prices of futures contracts on physical commodities on the commodity markets. All returns represent total return for stated period.
Past performance is not indicative of future results. Investments may be speculative, illiquid and there is a risk of total loss. There is no guarantee that any specific outcome will be achieved. This is not an offer to buy or sell securities. We do not offer legal, tax or financial advice. Information is purported to be as of the time period provided therein. Charts/graphs are for illustrative purposes only.
Cautionary Statement Concerning Forward-Looking Statements:
This document contains forward-looking statements. In addition, from time to time, we or our representatives may make forward-looking statements orally or in writing. We base these forward-looking statements on our expectations and projections about future events, which we derive from the information currently available to us. Such forward-looking statements relate to future events or our future performance, including: our financial performance and projections; our growth in revenue and earnings; and our business prospects and opportunities. You can identify forward-looking statements by those that are not historical in nature, particularly those that use terminology such as “may,” “should,” “expects,” “anticipates,” “contemplates,” “estimates,” “believes,” “plans,” “projected,” “predicts,” “potential,” or “hopes” or the negative of these or similar terms. In evaluating these forward-looking statements, you should consider various factors, including: our ability to change the direction of the Company; our ability to keep pace with new technology and changing market needs; and the competitive environment of our business. These and other factors may cause our actual results to differ materially from any forward-looking statement. Forward-looking statements are only predictions. The forward-looking events discussed in this document and other statements made from time to time by us or our representatives, may not occur, and actual events and results may differ materially and are subject to risks, uncertainties and assumptions about us. We are not obligated to publicly update or revise any forward-looking statement, whether as a result of uncertainties and assumptions, the forward-looking events discussed in this document and other statements made from time to time by us or our representatives might not occur.