
Fear in the Markets
June 21th, 2022
Macro Commentary
Key Takeaways
- The Fed continues to fight inflation via aggressive rate hikes
- Terminal rate expectations have moved nearer to 4%
- Recession inevitabilities & sustained inflation remain likely in near term
Equities are positive Tuesday morning after a welcomed extended holiday weekend following a brutal week for markets. The FOMC raised interest rates by 75 basis points which many strategists expected last Wednesday moving the inflation strategy process from a bit passive to more aggressive. After a brief relief rally post announcement, equities turned lower and rates grew volatile, swinging from a high level of 3.5% down to 3.2% by Thursday before settling close to 3.25%. Current yield curve has moved lower since last week, but still notably higher than a month ago. S&P 500 index trended lower through the week, losing about 200 points before settling around 3,675 Friday afternoon. Markets anticipate another 50-75 basis points at the next FOMC meeting in July, and 50 more basis points in September as well. Terminal rate expectations also moved higher to about 3.9% by mid-2023, up from 3% last month. Some banks are calling for a terminal rate over 4% based on current market conditions and what they think is needed to slow inflation.
Growth prospects are being re-evaluated during this time as well, with Goldman Sachs calling for a 30% probability of entering a recession over the next year, an update from 15% before the recent economic activity. With gas prices reaching historical highs and grocery bills trending higher, little relief is anticipated in the near term. While housing starts trended lower last week, initial jobless claims remained unchanged at historical lows, with another lower expected indication this week. The University of Michigan sentiment will be released Friday which is expected to sustain downward movement close to a 50 level reading, down from about 70 at the beginning of the year. Unfortunately, this too is at a historic low, with previous levels in the high 50s reached during the credit crisis and early 80s.
On Chain Commentary
Key Takeaways
- Digital asset markets continue dealing with fallout from the Terra & UST collapse
- Several crypto firms have announced layoffs, distress, and restructuring
- Technicals dating back to Bitcoin's inception show price reaching key levels
Fear in the markets may have reached an intermediate crescendo over the past week; crypto lender Celsius shuttered withdrawals and announced a restructuring plan, crypto companies Voyager and BlockFi have admitted duress and successfully obtained lines of credit with crypto exchange FTX. Crypto firm Three Arrows Capital, which had hedge fund, venture capital, treasury management, and OTC desk capabilities was also allegedly forcibly liquidated by several lenders and potentially owes millions more. On-chain evidence also shows Bitcoin moving out of several miner wallets to crypto exchanges, indicative of selling behaviors. This broad unraveling of liquidity and credit initially stemmed from both the multi-billion dollar collapse of the Terra blockchain and UST stablecoin in May, as well as an increasingly hawkish Fed and strong digital asset correlations to traditional markets.
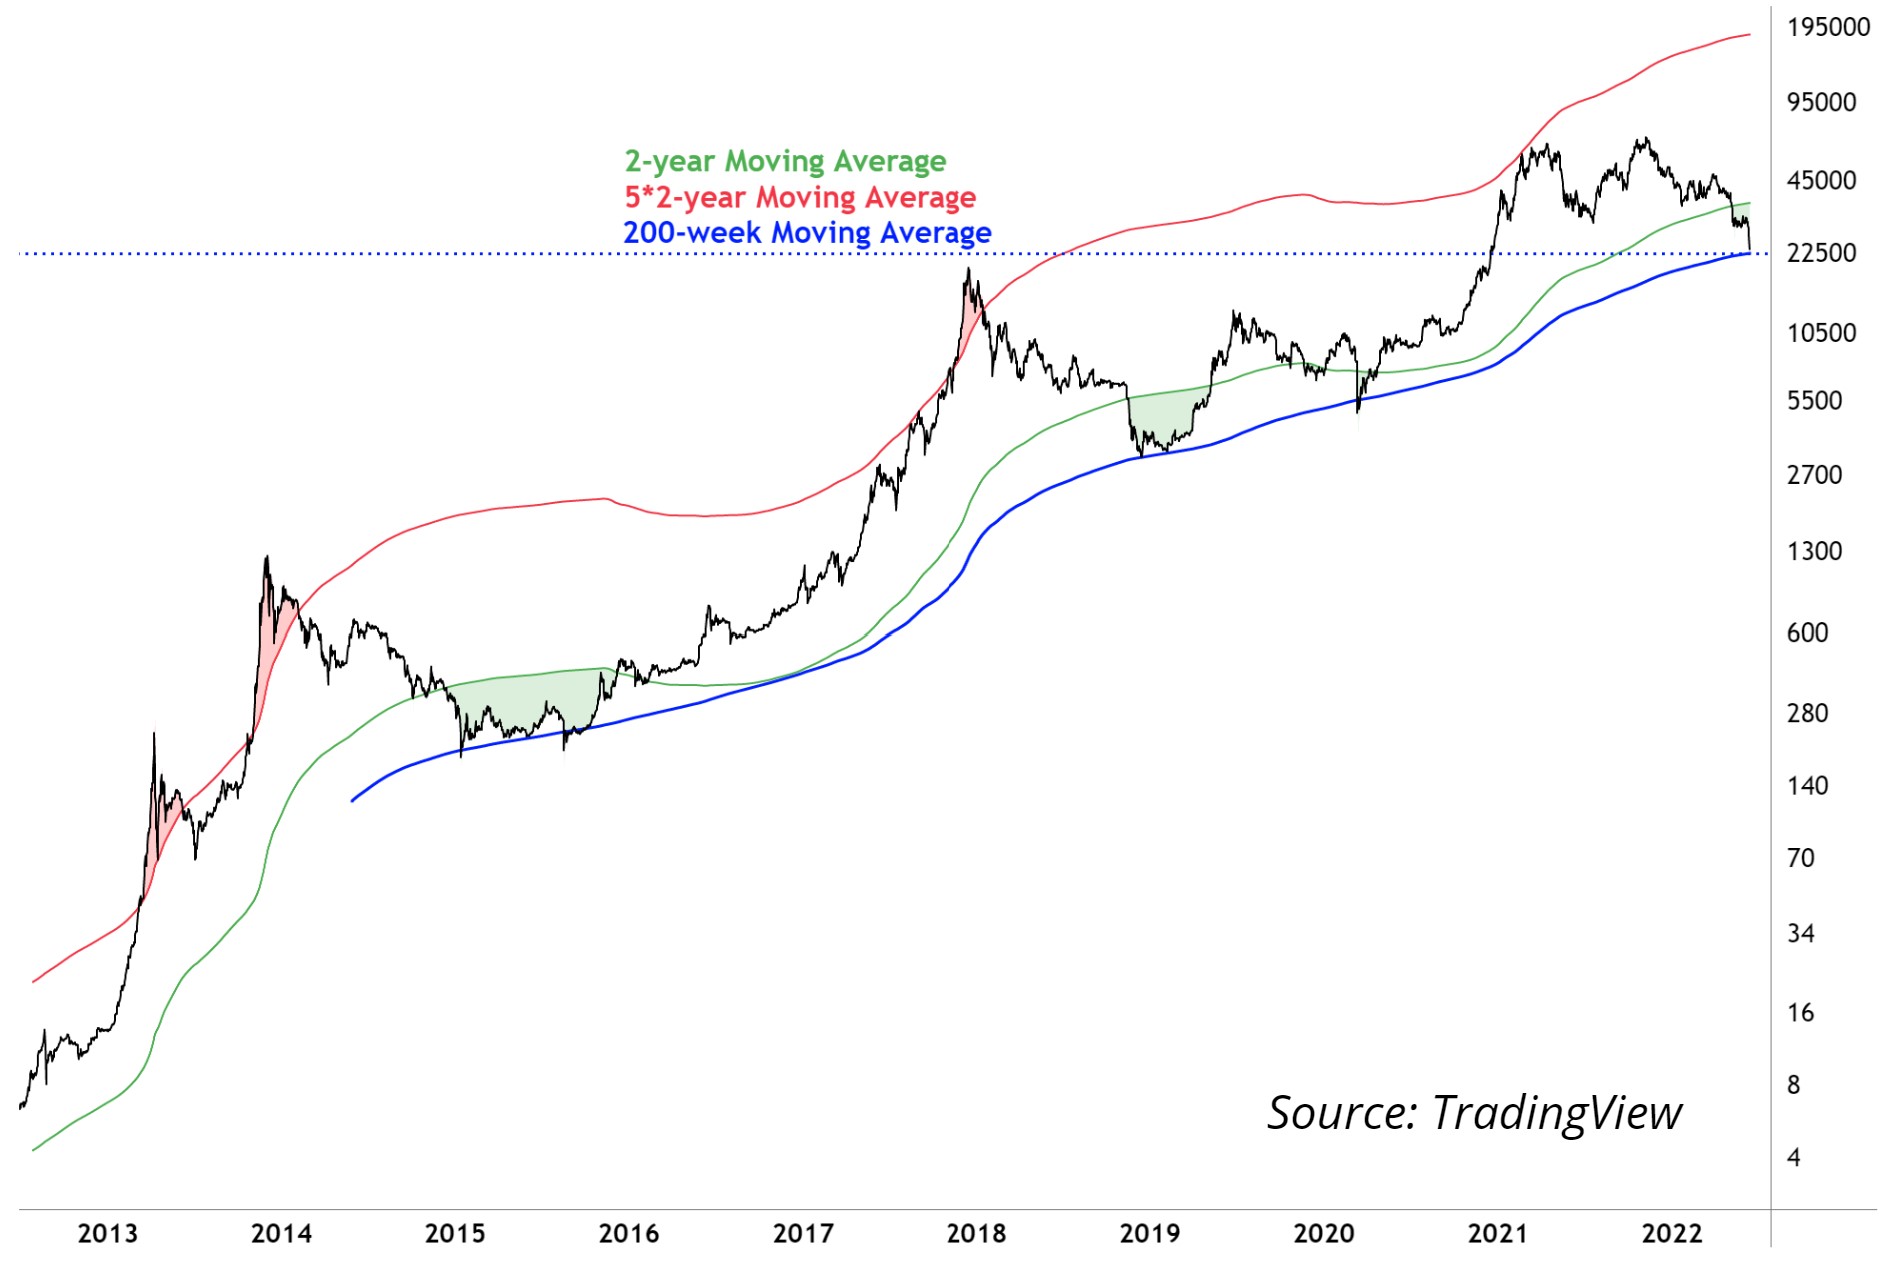
On a technical basis, Bitcoin has fallen below the 200-week moving average for only the fourth time ever, and has tested the previous cycle’s all-time high at $19,000 for the first time ever. Additionally, the current price is also below Bitcoin’s realized price, or aggregate average price of all coins moved on-chain, at $22,600. Historically, both the 200-week moving average and the realized price have acted as an accumulation zone for market participants in prior bear markets. Bitcoin’s weekly Relative Strength Index (RSI) is also currently sitting at or near all-time lows.
News Review
- Deloitte and NYDIG Announce Alliance to Provide Banking for All With Bitcoin
- JPMorgan Wants to Bring Trillions of Dollars of Tokenized Assets to DeFi
- Musk Sees Logic for Twitter as a Crypto Payments Platform
- Why Bitcoin Mining is Taking Off in the Lone Star State
- Bitcoin miners’ exchange flow reaches 7-month high as BTC price tanks below $21K
- CleanSpark Takes Advantage of Bear Market to Acquire Mining Rig Contracts
- Circle Announces a Fully-reserved, Euro-backed Stablecoin, Euro Coin (EUROC)
- Cryptocurrencies: Tether is 'open to providing more information'
- Bitso Processed $1B in Crypto Remittances Between Mexico and the US so far in 2022
- Solana’s New Gas Fees Won’t Make the Network 'Expensive,' Says Co-Founder
- Crypto Hedge Fund Three Arrows Capital Considers Asset Sales, Bailout
- Genesis Trading Mitigated Losses With a 'Large Counterparty,' CEO Says
- Coinbase to Lay Off 18% of Staff Amid Crypto Meltdown
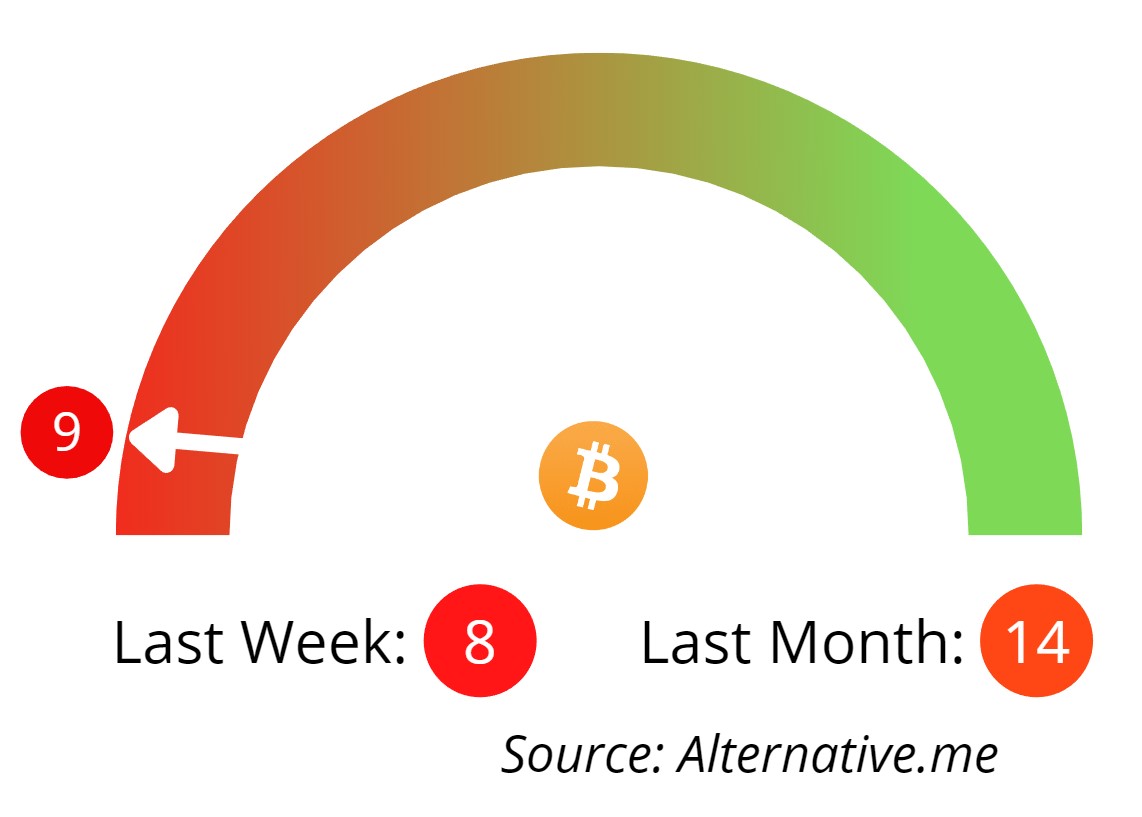
Bitcoin Fear and Greed Index
Multifactorial Market Sentiment Analysis
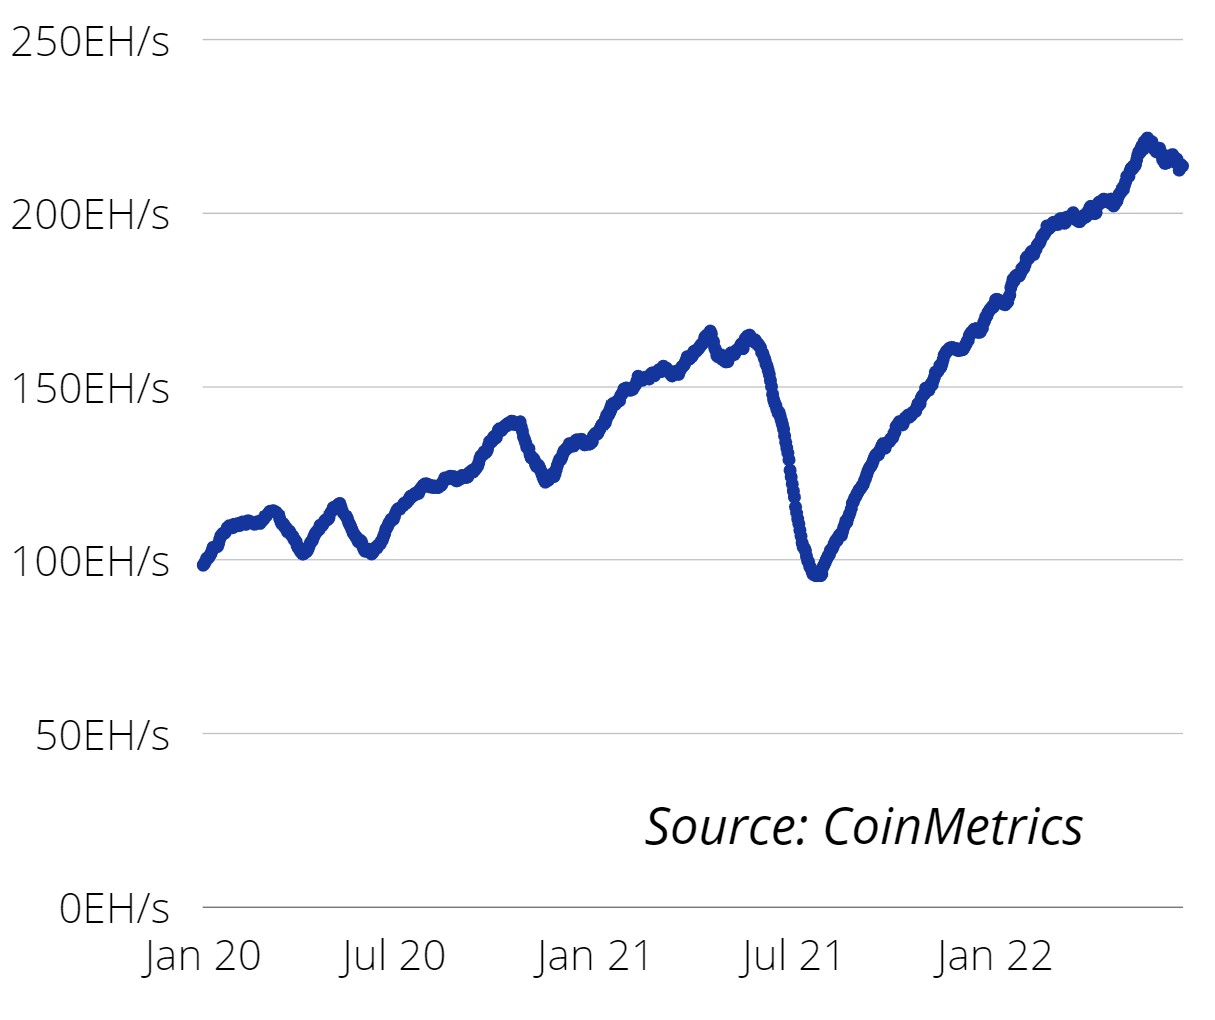
Bitcoin Monthly Average Hashrate
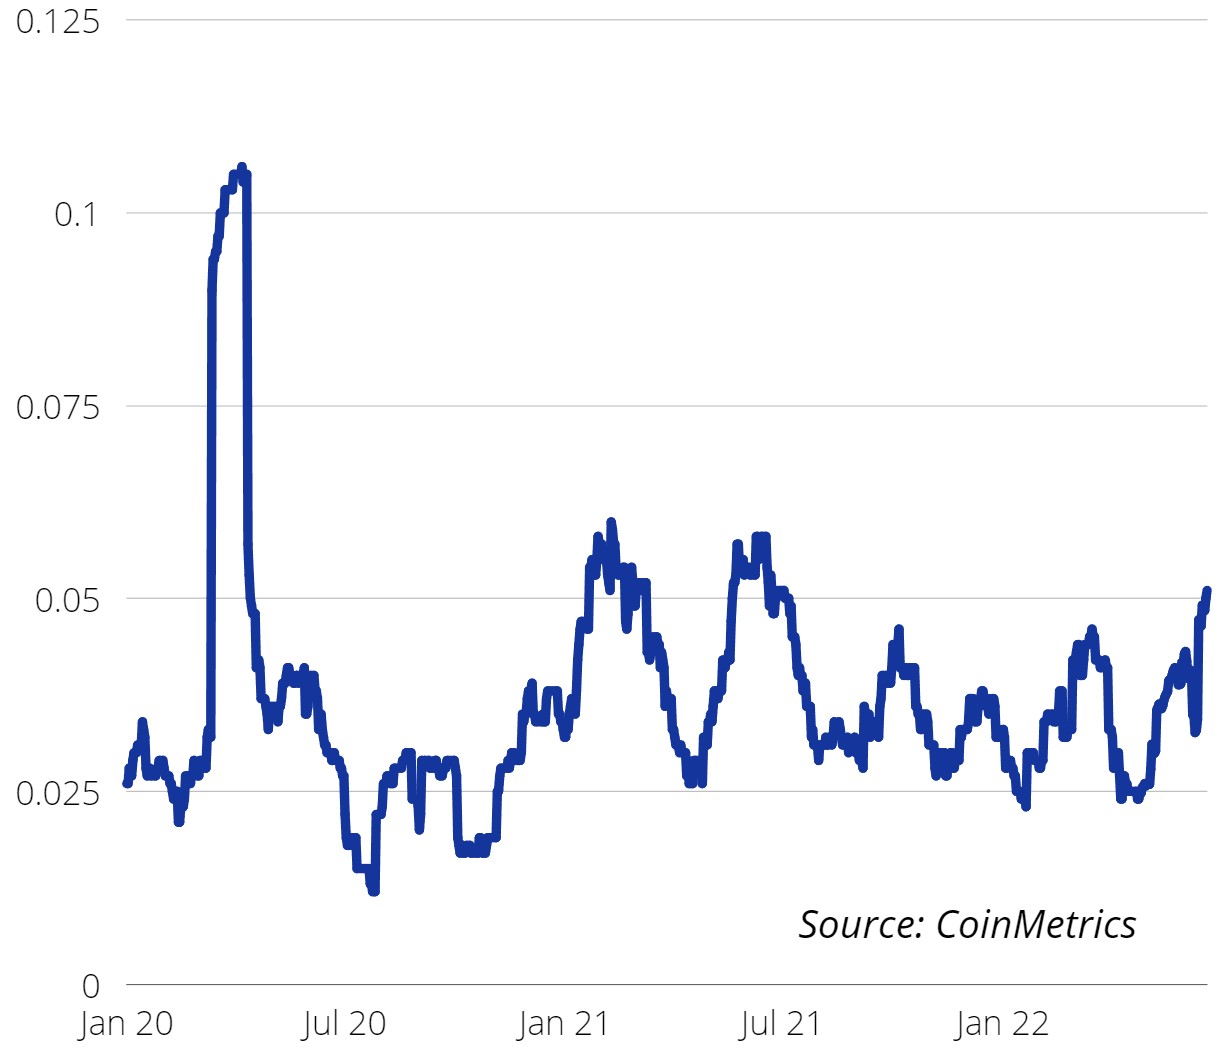
Bitcoin 30-Day Rolling Volatility
Bitcoin Moving Averages
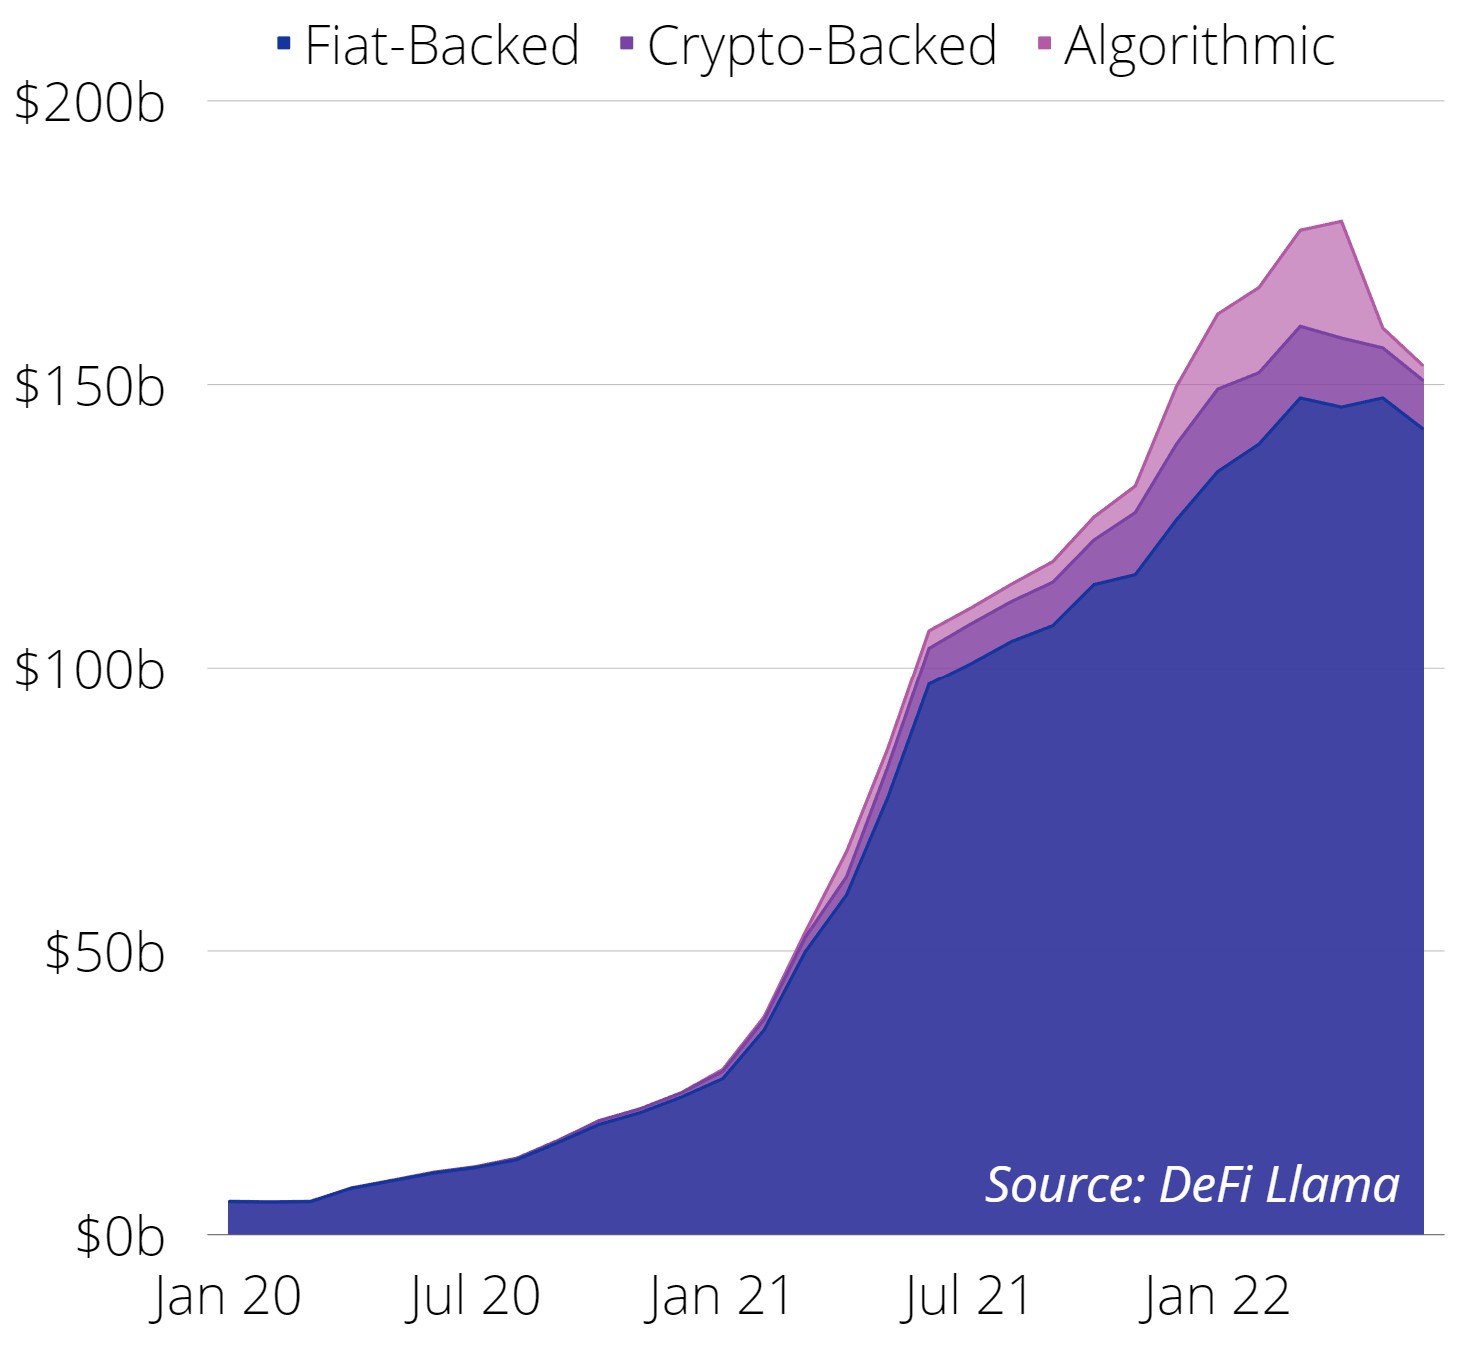
Stablecoin Circulating Supply
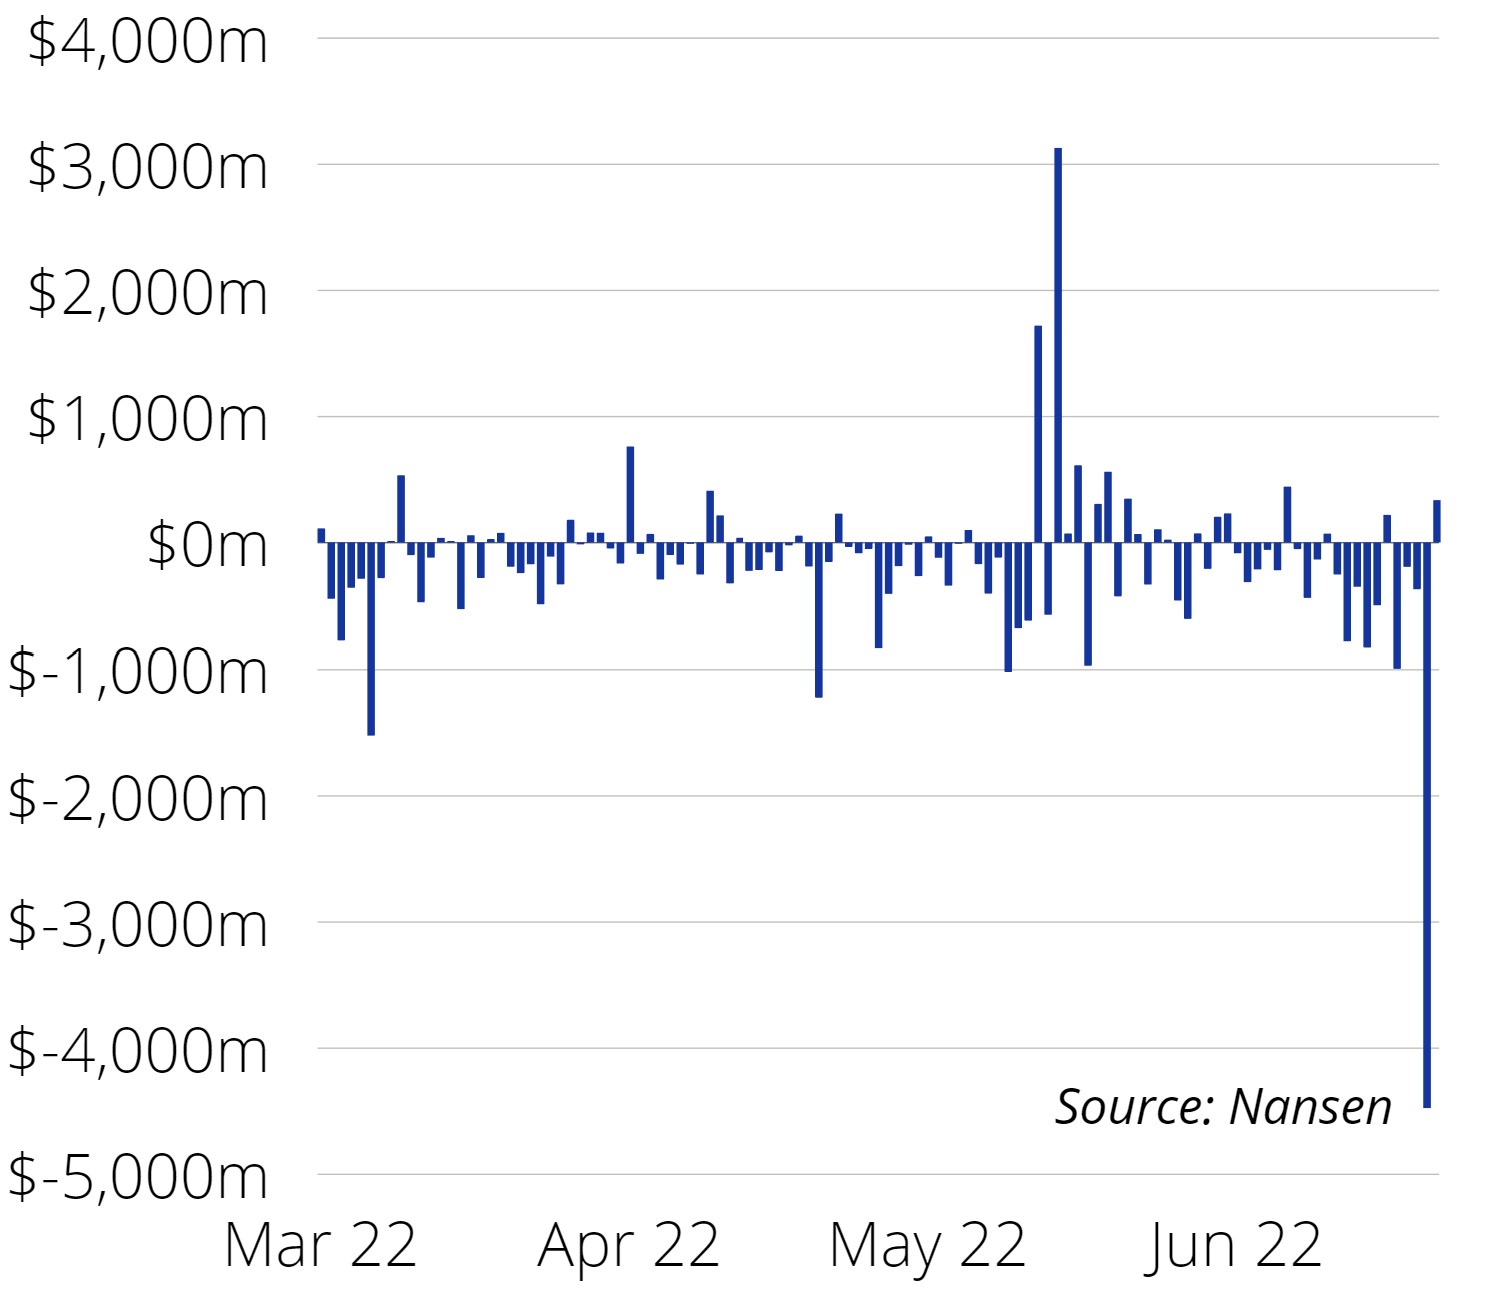
Stablecoin Net Exchange Flow
The Portfolio Management Team
Steven McClurg, CIO
Bill Cannon, Portfolio Manager
Wes Cowan, Portfolio Manager, Head of Defi
Josh Olszewicz, Head of Research
Sean Rooney, VP Research and Trading
Will McDonough, Vice Chairman, Investment Committee
Leah Wald, CEO, Investment Committee
Shannon Smith, Head of Investor Relations
Weekly Thoughts: Source: Valkyrie Investments, Inc.
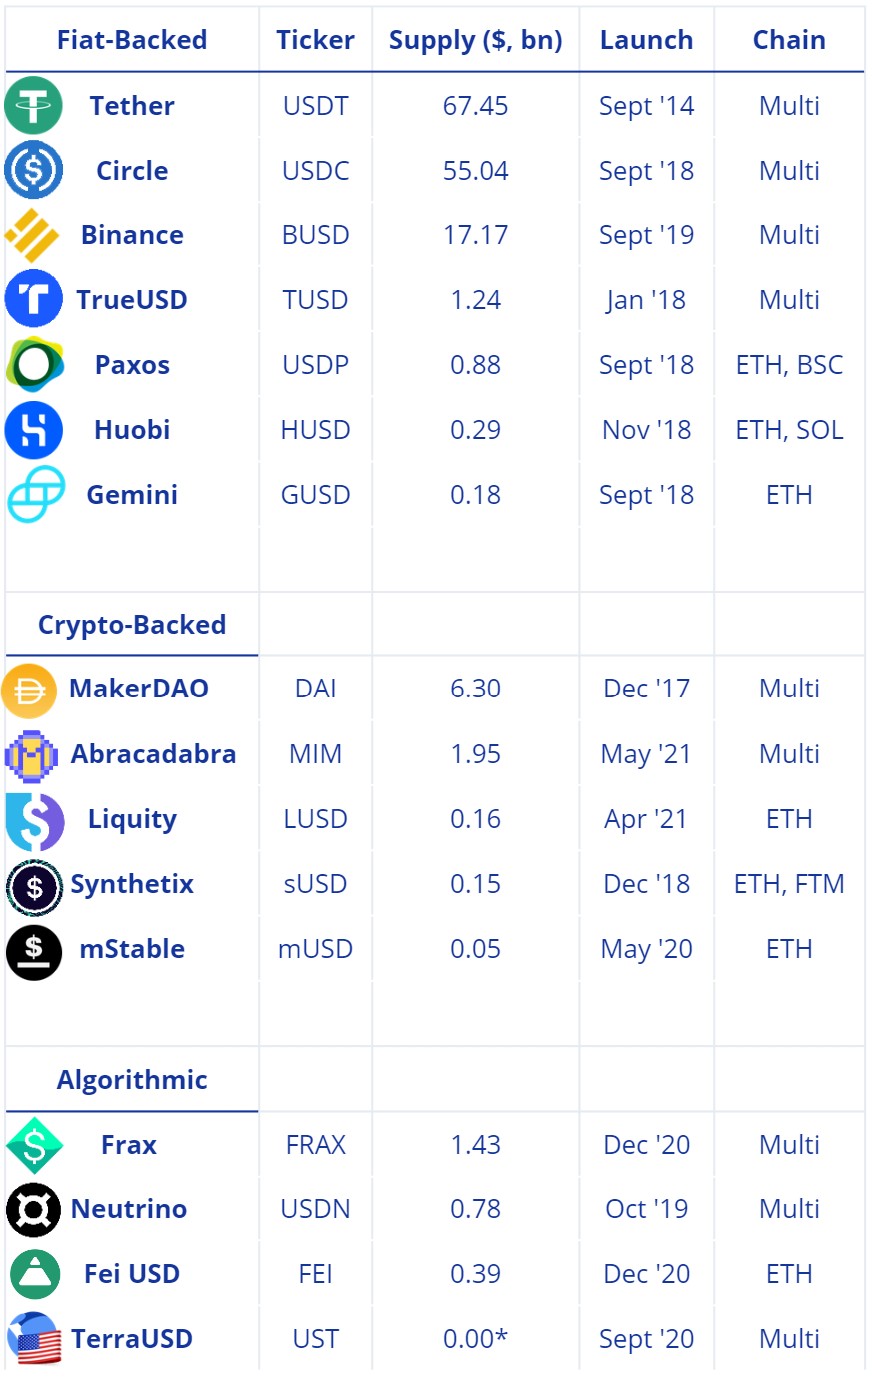
Stablecoin Origins & Purpose, Fiat-Backed, Crypto-Backed, Algorithmic, Terra and UST De-pegging Event: Valkyrie Investments, Inc., Tether Operations, CoinMetrics, Circle, and Paxos
Macro Commentary: Source: Valkyrie Investments, Inc.
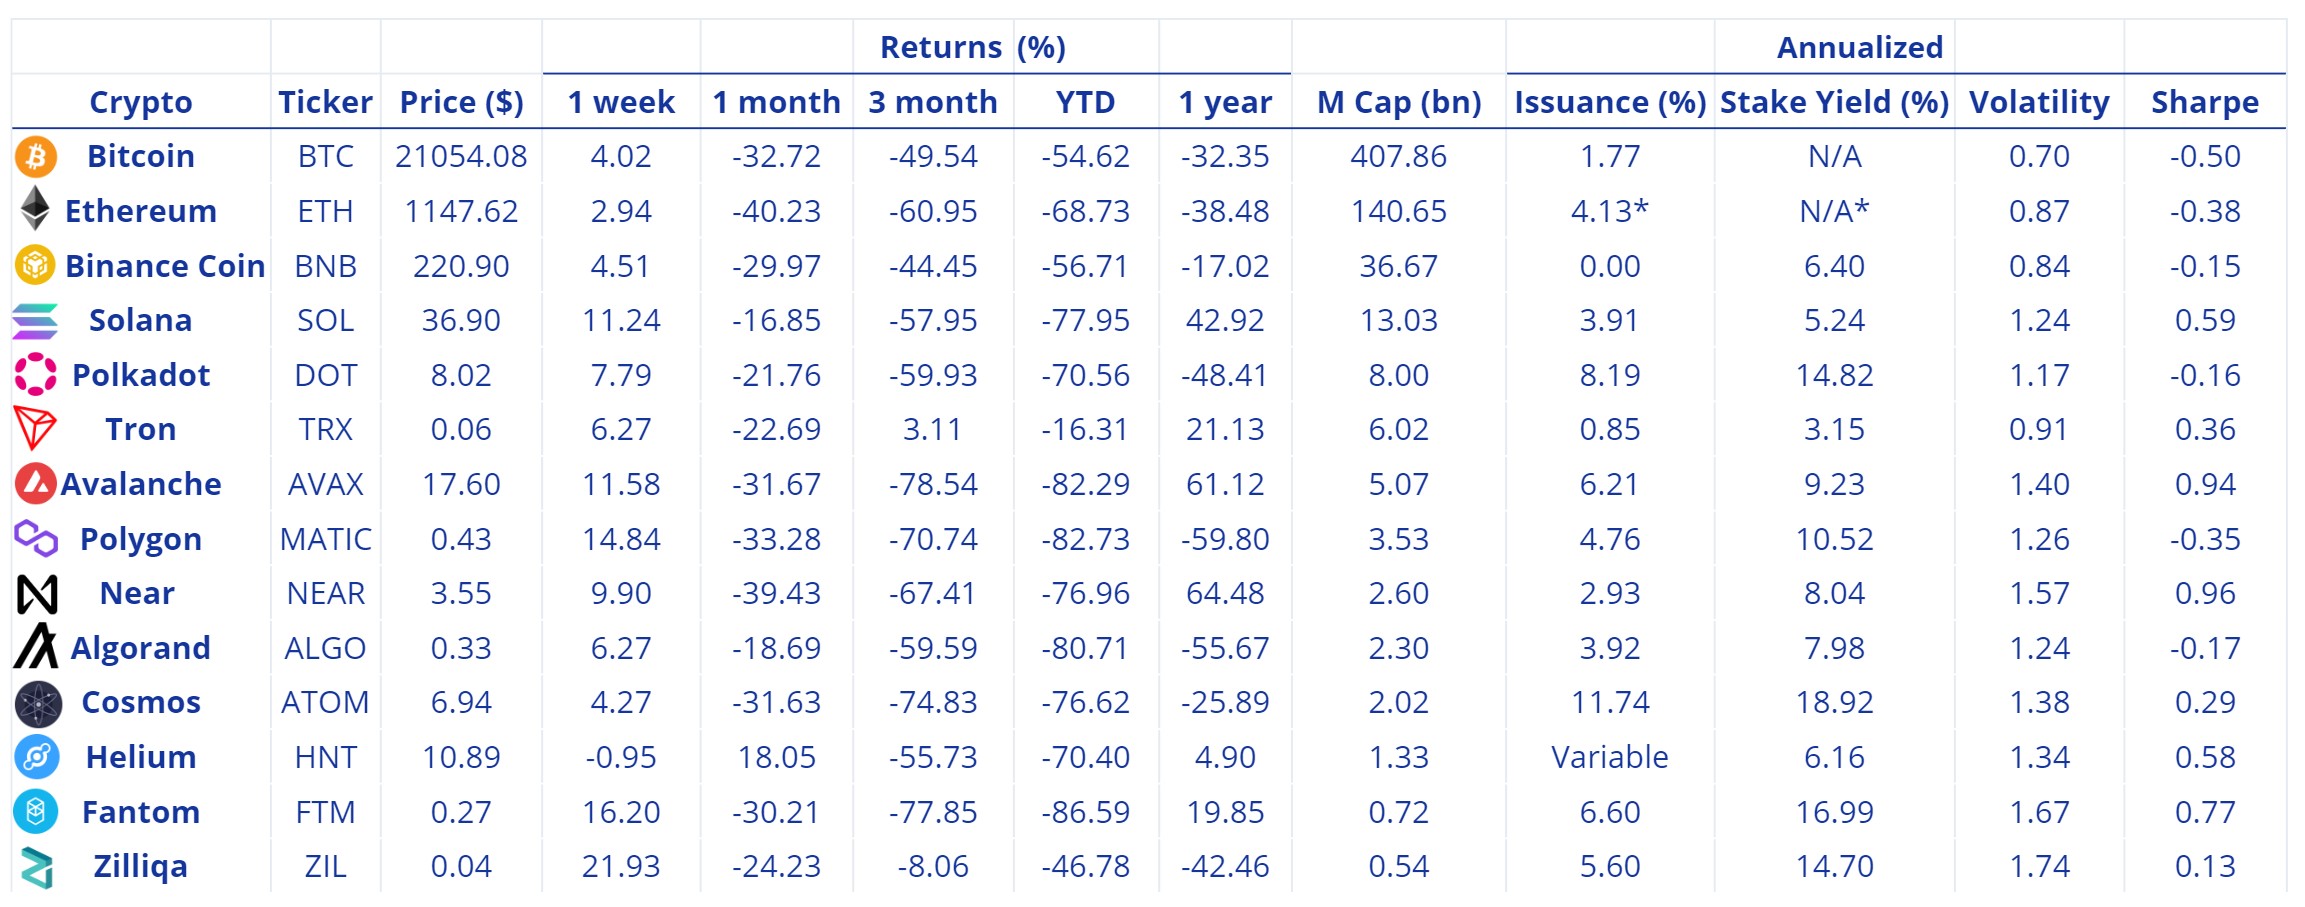
Coin Prices, Market Capitalizations, and Returns: Source: Valkyrie Investments, Inc., TradingView, Messari. All returns represent total return for stated period. Coin Logos: Source: cryptologos.cc
Annualized Issuance, Staking Yield, Volatility, and Sharpe Ratio: Source: Valkyrie Investments, Inc., Messari, StakingRewards.com. *ETH's EIP-1559 token burn and ETH-2 staking not included.
Bitcoin Fear and Greed Index Source: Valkyrie Investments, Inc., alternative.me and represents a multifactorial sentiment analysis index of volatility, market momentum and volume, social media, bitcoin market cap dominance, and Google trends
Bitcoin Monthly Average Hashrate, Bitcoin 30-Day Rolling Volatility: Source: Valkyrie Investments, Inc., CoinMetrics
Bitcoin Weekly Moving Averages: Source: Valkyrie Investments, Inc., TradingView - INDEX:BTCUSD
Stablecoin Circulating Supply: Source: Valkyrie Investments, CoinMetrics, The Block, and CoinGecko
Stablecoin Net Exchange Flow: Source: Valkyrie Investments, Inc., Nansen and represent wallet inflows and outflows of Tether, USD Coin, Binance USD, PAX, and Huobi USD through crypto exchanges, including but not limited to; Binance, Curve.fi, AnySwap, Crypto.com, Uniswap, Hop Protocol, OKEx, Kucoin, dYdX, Coinbase, Kraken, Huobi, FTX, Gemini, FTX US, CoinList, SushiSwap, Gate.io, Balancer, BitMEX, Bitfinex, Bittrex, Binance US, Bitstamp, BlockFi, Paxos, Celsius, Alameda OTC, Poloniex, HitBTC, Bancor, Kyber, and ShibaSwap.
List and examples shown in the Stablecoin table are non-exhaustive, intended for illustrative purposes only. Chain data sourced from CoinMarketCap. "Multi" description can include Ethereum, Solana, Binance Smart Chain, Algorand, Tron, Fantom, Polygon, Avalanche, Arbitrum, Secret, Terra, Moonriver, Velas, and Harmony. Coin Logos: Source: cryptologos.cc
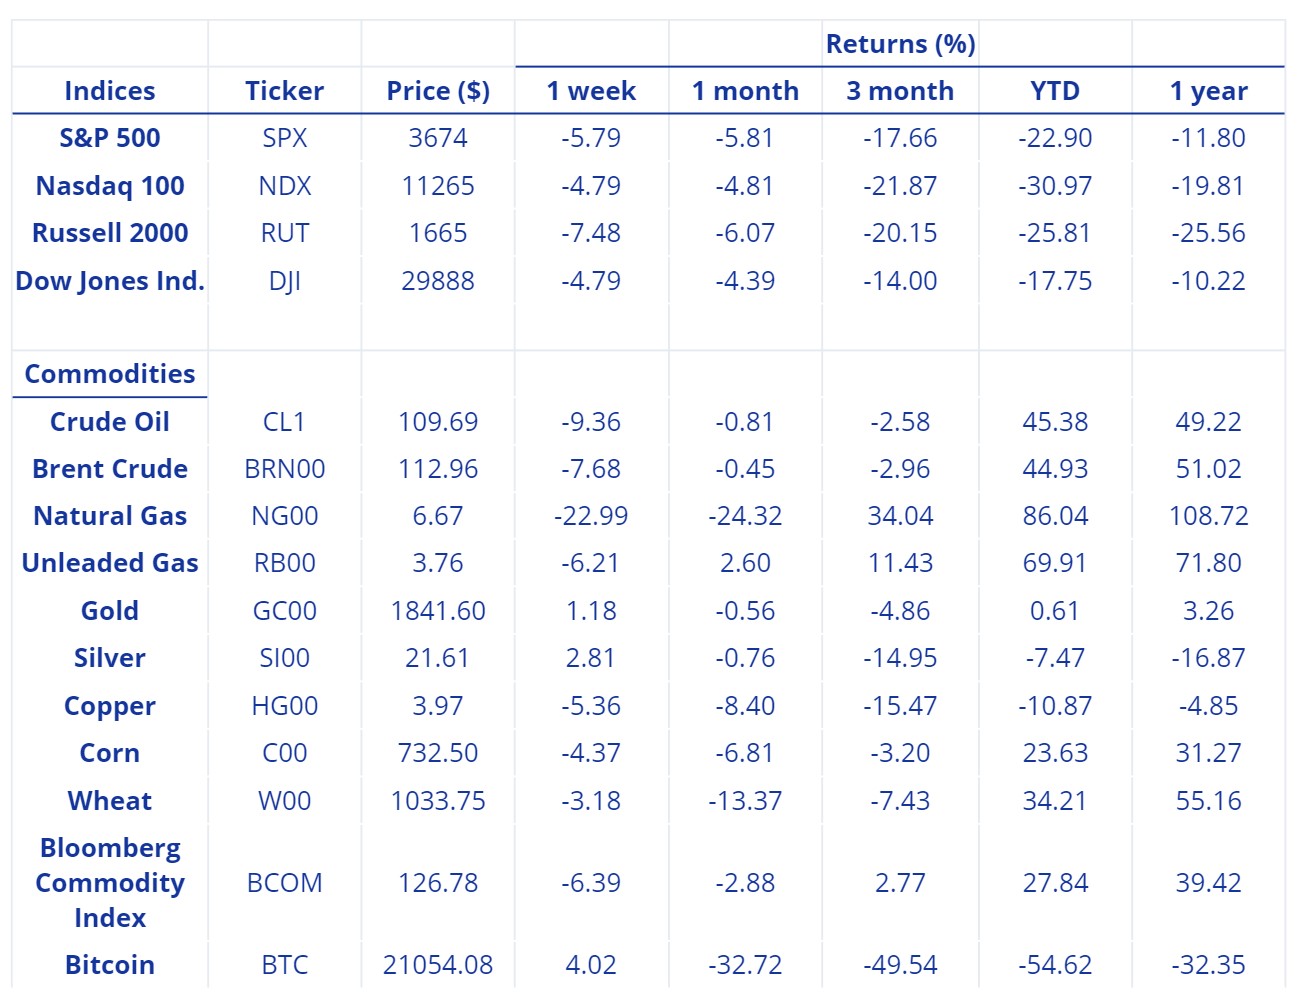
"Indicies" prices and returns: Source: Valkyrie Investments, Inc., MarketWatch. "S&P 500" provided by Standard & Poor’s and is a stock market index tracking the performance of 500 large companies listed on stock exchanges in the United States, "Nasdaq 100" provided by NASDAQ OMX Group and includes 100 of the largest domestic and international non-financial companies listed on the Nasdaq Stock Market based on market capitalization. "Russell 2000" provided by FTSE Russell and is a small-cap stock market index that makes up the smallest 2,000 stocks in the Russell 3000 Index. "Dow Jones Ind." provided by S&P Dow Jones Indices and is a price-weighted measurement stock market index of 30 prominent companies listed on stock exchanges in the United States. "Gold" provided by NYMEX - CME Group and is a continuous futures product. All returns represent total return for stated period.
"Commodities" prices and returns: Source: Valkyrie Investments, Inc., Wall Street Journal. Bloomberg Commodity Index provided by Bloomberg and tracks prices of futures contracts on physical commodities on the commodity markets. All returns represent total return for stated period.
Past performance is not indicative of future results. Investments may be speculative, illiquid and there is a risk of total loss. There is no guarantee that any specific outcome will be achieved. This is not an offer to buy or sell securities. We do not offer legal, tax or financial advice. Information is purported to be as of the time period provided therein. Charts/graphs are for illustrative purposes only.
Cautionary Statement Concerning Forward-Looking Statements:
This document contains forward-looking statements. In addition, from time to time, we or our representatives may make forward-looking statements orally or in writing. We base these forward-looking statements on our expectations and projections about future events, which we derive from the information currently available to us. Such forward-looking statements relate to future events or our future performance, including: our financial performance and projections; our growth in revenue and earnings; and our business prospects and opportunities. You can identify forward-looking statements by those that are not historical in nature, particularly those that use terminology such as “may,” “should,” “expects,” “anticipates,” “contemplates,” “estimates,” “believes,” “plans,” “projected,” “predicts,” “potential,” or “hopes” or the negative of these or similar terms. In evaluating these forward-looking statements, you should consider various factors, including: our ability to change the direction of the Company; our ability to keep pace with new technology and changing market needs; and the competitive environment of our business. These and other factors may cause our actual results to differ materially from any forward-looking statement. Forward-looking statements are only predictions. The forward-looking events discussed in this document and other statements made from time to time by us or our representatives, may not occur, and actual events and results may differ materially and are subject to risks, uncertainties and assumptions about us. We are not obligated to publicly update or revise any forward-looking statement, whether as a result of uncertainties and assumptions, the forward-looking events discussed in this document and other statements made from time to time by us or our representatives might not occur.