
Ride The Waves
June 27th, 2022
Macro Commentary
Key Takeaways
- Inflation strategies remain top of mind for heads of global economies
- Sanctions push Russia to miss first foreign debt payment since 1918
- University of Michigan consumer sentiment has reached an all-time low
The upcoming holiday weekend marks the conclusion of a volatile second quarter and sets up what could be a definitive direction in the current US inflation management strategy. The G7 is meeting this week in Germany, following Russia's first debt default in 100 years due to payment restrictions placed under the imposed sanctions related to the Ukrainian-Russian war, now in its fourth month. Leaders of the top economies of the world will be talking about further sanctions on Russian gold and oil pricing, in addition to possible solutions regarding rising food costs and gas prices.
Investors enjoyed a reprieve from the current norm last week with equities edging higher while rates buoyed down then up before the weekend. Positive market trends could mean momentum in the hope of less rate hikes, but economic data suggests there will be challenges ahead. Friday's University of Michigan consumer sentiment reached an all-time low, confirming how investors see the road ahead. Housing related indicators were mixed as existing home sales declined Monday, as expected, while new home sales rose unexpectedly in what could be the last increase this year due to buyers trying to lock in lower costs. Elevated mortgage rates are frustrating potential buyers that are considering higher monthly payments. This could naturally help calm the housing market and re-balance supply and demand metrics, which could be one benefit as Fed officials are looking for indications the economy is slowing down as intended.
On Chain Commentary
Key Takeaways
- Digital asset markets have begun to stabilize in the face of credit contractions
- Q2 will likely close deeply negative for many crypto assets, a historic reversal
- Technicals dating back to Bitcoin's inception show price maintaining key levels
Digital asset markets have begun to stabilize as crypto lenders continue to slowly reveal the full scope of recent liquidation fallout connected to crypto firm Three Arrows Capital (3AC). Crypto lender Voyager's exposure to 3AC consists of 15,250 Bitcoin and $350 million USDC.
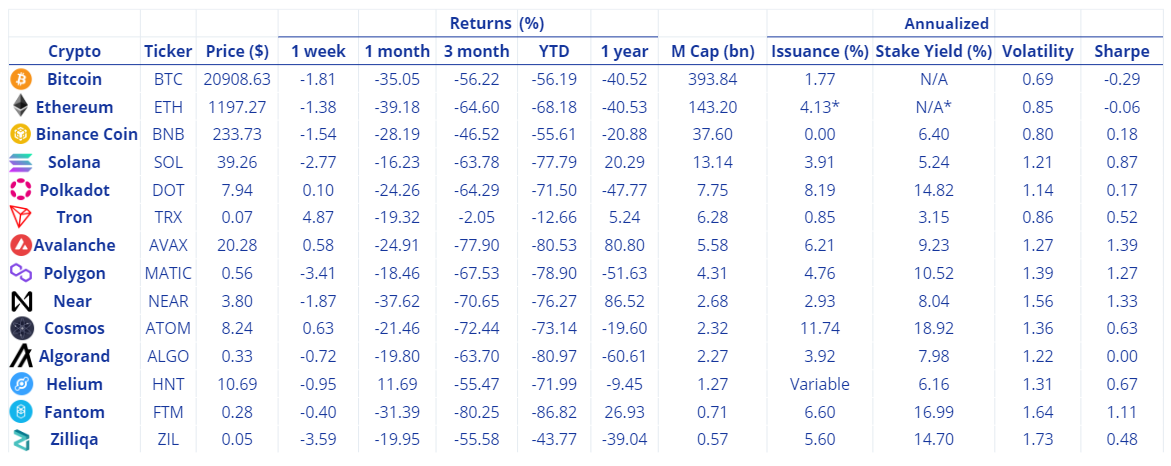
As Q2 draws to a close, Bitcoin sits at -55% on the quarter, likely finishing as the worst performing Q2 on record. Since 2013, Q2 and Q4 have historically been the best performing quarters for Bitcoin. Ethereum, which has never had a negative performing Q2 since 2016, is down 63% on the quarter. This will also likely close as Ethereum’s worst performing quarter on record.
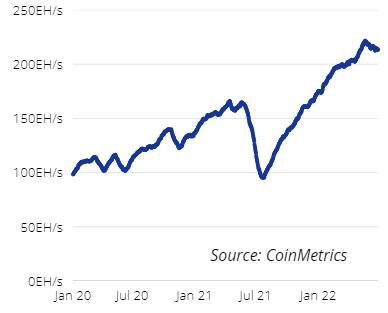
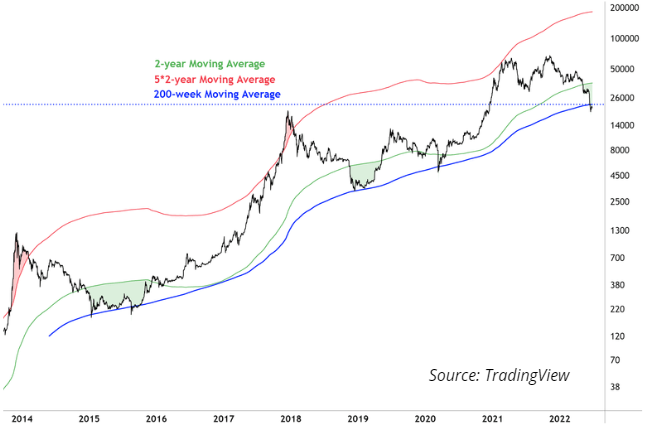
On a technical basis, Bitcoin and Ethereum continue to hold at or near their respective 200-week moving averages, previous all-time highs, and realized price, or aggregate average price of all coins moved on-chain. Historically in prior bear markets, both the 200-week moving average and realized price have acted as an accumulation zone on Bitcoin and Ethereum for market participants. Both assets are also now seeing declines in hash rate from all-time highs, suggestive of some miners no longer maintaining profitability relative to costs.
News Review
- Coinbase Launches First Crypto Derivatives Product Aimed at Retail Traders
- Coinbase Wallet introduces support for the Solana ecosystem
- Why Solana Is Going Big on Mobile—And Making a Smartphone
- Binance.US Eliminates Spot Trading Fees on Bitcoin
- Himes Proposes Central Bank Digital Currency
- Tether To Launch GBP₮, Tether Tokens Pegged to the British Pound Sterling
- Almost $4 Billion in Bitcoin Miner Loans Are Coming Under Stress
- Avalanche Bridge Adds Native Bitcoin Support
- dYdX to expand to its own blockchain in the Cosmos ecosystem
- The Great Crypto Consolidation: Nexo’s Role in Aiding Businesses and Investors Through the Turmoil
- Celsius Network hires advisors to prepare for potential bankruptcy
- Prime Trust Raises $107M With Eyes on Crypto IRA, Tokenized Asset Products
- Crypto platform FalconX doubles valuation to $8 bln in new funding round
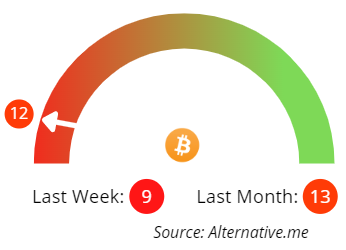
Bitcoin Fear and Greed Index
Multifactorial Market Sentiment Analysis
Bitcoin Monthly Average Hashrate
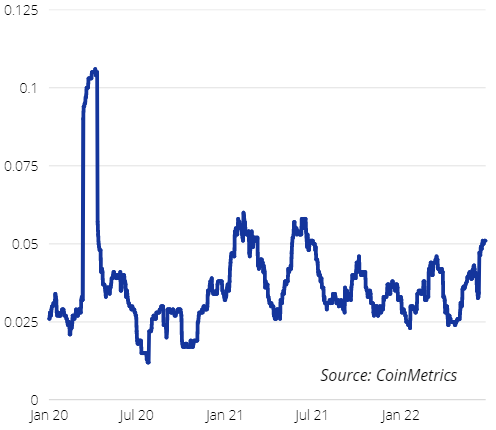
Bitcoin 30-Day Rolling Volatility
Bitcoin Moving Averages
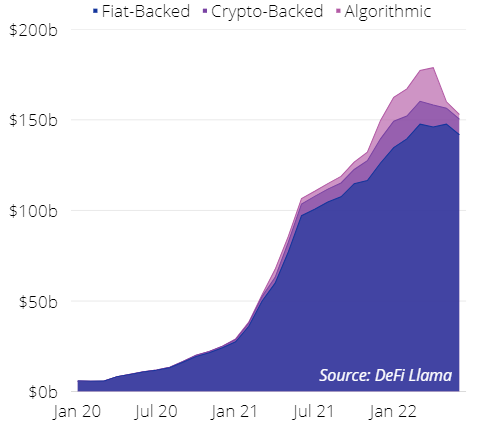
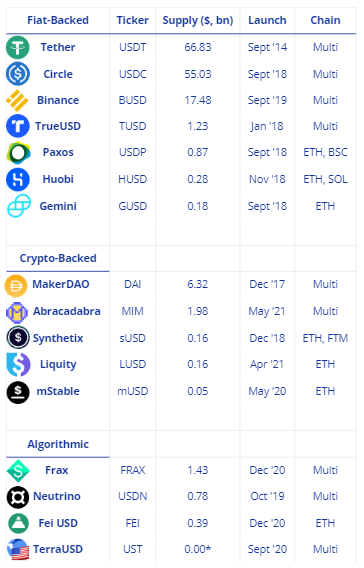
Stablecoin Circulating Supply
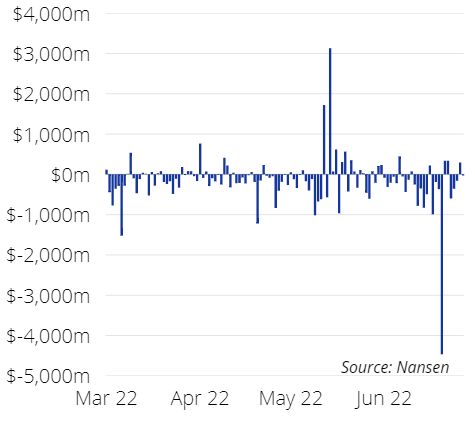
Stablecoin Net Exchange Flow
The Portfolio Management Team
Steven McClurg, CIO
Bill Cannon, Portfolio Manager
Wes Cowan, Portfolio Manager, Head of Defi
Josh Olszewicz, Head of Research
Sean Rooney, VP Research and Trading
Will McDonough, Vice Chairman, Investment Committee
Leah Wald, CEO, Investment Committee
Shannon Smith, Head of Investor Relations
Weekly Thoughts: Source: Valkyrie Investments, Inc.
Stablecoin Origins & Purpose, Fiat-Backed, Crypto-Backed, Algorithmic, Terra and UST De-pegging Event: Valkyrie Investments, Inc., Tether Operations, CoinMetrics, Circle, and Paxos
Macro Commentary: Source: Valkyrie Investments, Inc.
Coin Prices, Market Capitalizations, and Returns: Source: Valkyrie Investments, Inc., TradingView, Messari. All returns represent total return for stated period. Coin Logos: Source: cryptologos.cc
Annualized Issuance, Staking Yield, Volatility, and Sharpe Ratio: Source: Valkyrie Investments, Inc., Messari, StakingRewards.com. *ETH's EIP-1559 token burn and ETH-2 staking not included.
Bitcoin Fear and Greed Index Source: Valkyrie Investments, Inc., alternative.me and represents a multifactorial sentiment analysis index of volatility, market momentum and volume, social media, bitcoin market cap dominance, and Google trends
Bitcoin Monthly Average Hashrate, Bitcoin 30-Day Rolling Volatility: Source: Valkyrie Investments, Inc., CoinMetrics
Bitcoin Weekly Moving Averages: Source: Valkyrie Investments, Inc., TradingView - INDEX:BTCUSD
Stablecoin Circulating Supply: Source: Valkyrie Investments, CoinMetrics, The Block, and CoinGecko
Stablecoin Net Exchange Flow: Source: Valkyrie Investments, Inc., Nansen and represent wallet inflows and outflows of Tether, USD Coin, Binance USD, PAX, and Huobi USD through crypto exchanges, including but not limited to; Binance, Curve.fi, AnySwap, Crypto.com, Uniswap, Hop Protocol, OKEx, Kucoin, dYdX, Coinbase, Kraken, Huobi, FTX, Gemini, FTX US, CoinList, SushiSwap, Gate.io, Balancer, BitMEX, Bitfinex, Bittrex, Binance US, Bitstamp, BlockFi, Paxos, Celsius, Alameda OTC, Poloniex, HitBTC, Bancor, Kyber, and ShibaSwap.
List and examples shown in the Stablecoin table are non-exhaustive, intended for illustrative purposes only. Chain data sourced from CoinMarketCap. "Multi" description can include Ethereum, Solana, Binance Smart Chain, Algorand, Tron, Fantom, Polygon, Avalanche, Arbitrum, Secret, Terra, Moonriver, Velas, and Harmony. Coin Logos: Source: cryptologos.cc
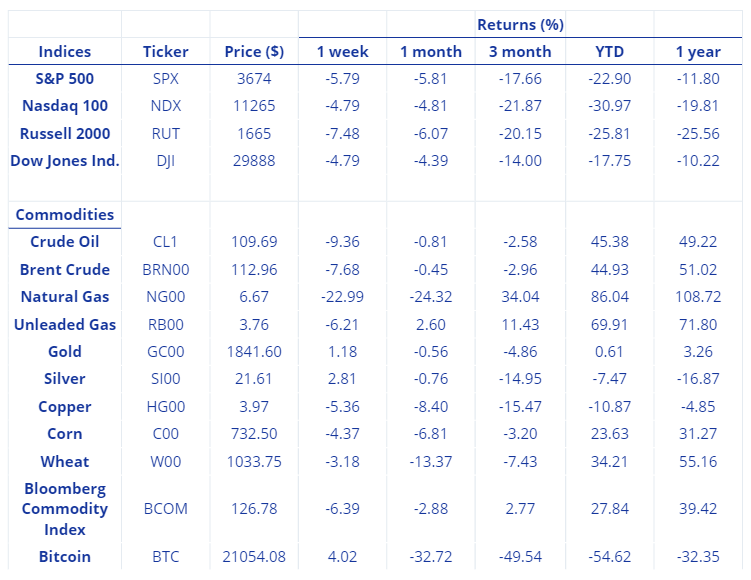
"Indicies" prices and returns: Source: Valkyrie Investments, Inc., MarketWatch. "S&P 500" provided by Standard & Poor’s and is a stock market index tracking the performance of 500 large companies listed on stock exchanges in the United States, "Nasdaq 100" provided by NASDAQ OMX Group and includes 100 of the largest domestic and international non-financial companies listed on the Nasdaq Stock Market based on market capitalization. "Russell 2000" provided by FTSE Russell and is a small-cap stock market index that makes up the smallest 2,000 stocks in the Russell 3000 Index. "Dow Jones Ind." provided by S&P Dow Jones Indices and is a price-weighted measurement stock market index of 30 prominent companies listed on stock exchanges in the United States. "Gold" provided by NYMEX - CME Group and is a continuous futures product. All returns represent total return for stated period.
"Commodities" prices and returns: Source: Valkyrie Investments, Inc., Wall Street Journal. Bloomberg Commodity Index provided by Bloomberg and tracks prices of futures contracts on physical commodities on the commodity markets. All returns represent total return for stated period.
Past performance is not indicative of future results. Investments may be speculative, illiquid and there is a risk of total loss. There is no guarantee that any specific outcome will be achieved. This is not an offer to buy or sell securities. We do not offer legal, tax or financial advice. Information is purported to be as of the time period provided therein. Charts/graphs are for illustrative purposes only.
Cautionary Statement Concerning Forward-Looking Statements:
This document contains forward-looking statements. In addition, from time to time, we or our representatives may make forward-looking statements orally or in writing. We base these forward-looking statements on our expectations and projections about future events, which we derive from the information currently available to us. Such forward-looking statements relate to future events or our future performance, including: our financial performance and projections; our growth in revenue and earnings; and our business prospects and opportunities. You can identify forward-looking statements by those that are not historical in nature, particularly those that use terminology such as “may,” “should,” “expects,” “anticipates,” “contemplates,” “estimates,” “believes,” “plans,” “projected,” “predicts,” “potential,” or “hopes” or the negative of these or similar terms. In evaluating these forward-looking statements, you should consider various factors, including: our ability to change the direction of the Company; our ability to keep pace with new technology and changing market needs; and the competitive environment of our business. These and other factors may cause our actual results to differ materially from any forward-looking statement. Forward-looking statements are only predictions. The forward-looking events discussed in this document and other statements made from time to time by us or our representatives, may not occur, and actual events and results may differ materially and are subject to risks, uncertainties and assumptions about us. We are not obligated to publicly update or revise any forward-looking statement, whether as a result of uncertainties and assumptions, the forward-looking events discussed in this document and other statements made from time to time by us or our representatives might not occur.