
Signal vs. Noise
Week of June 6th, 2022
Weekly Thoughts
Key Takeaways
- Bitcoin closed green last week, the first green week since late March
- Technicals for Bitcoin remain bearish and potentially show oversold conditions
- Bitcoin hash rate has begun to decline, as profitability declines for some miners
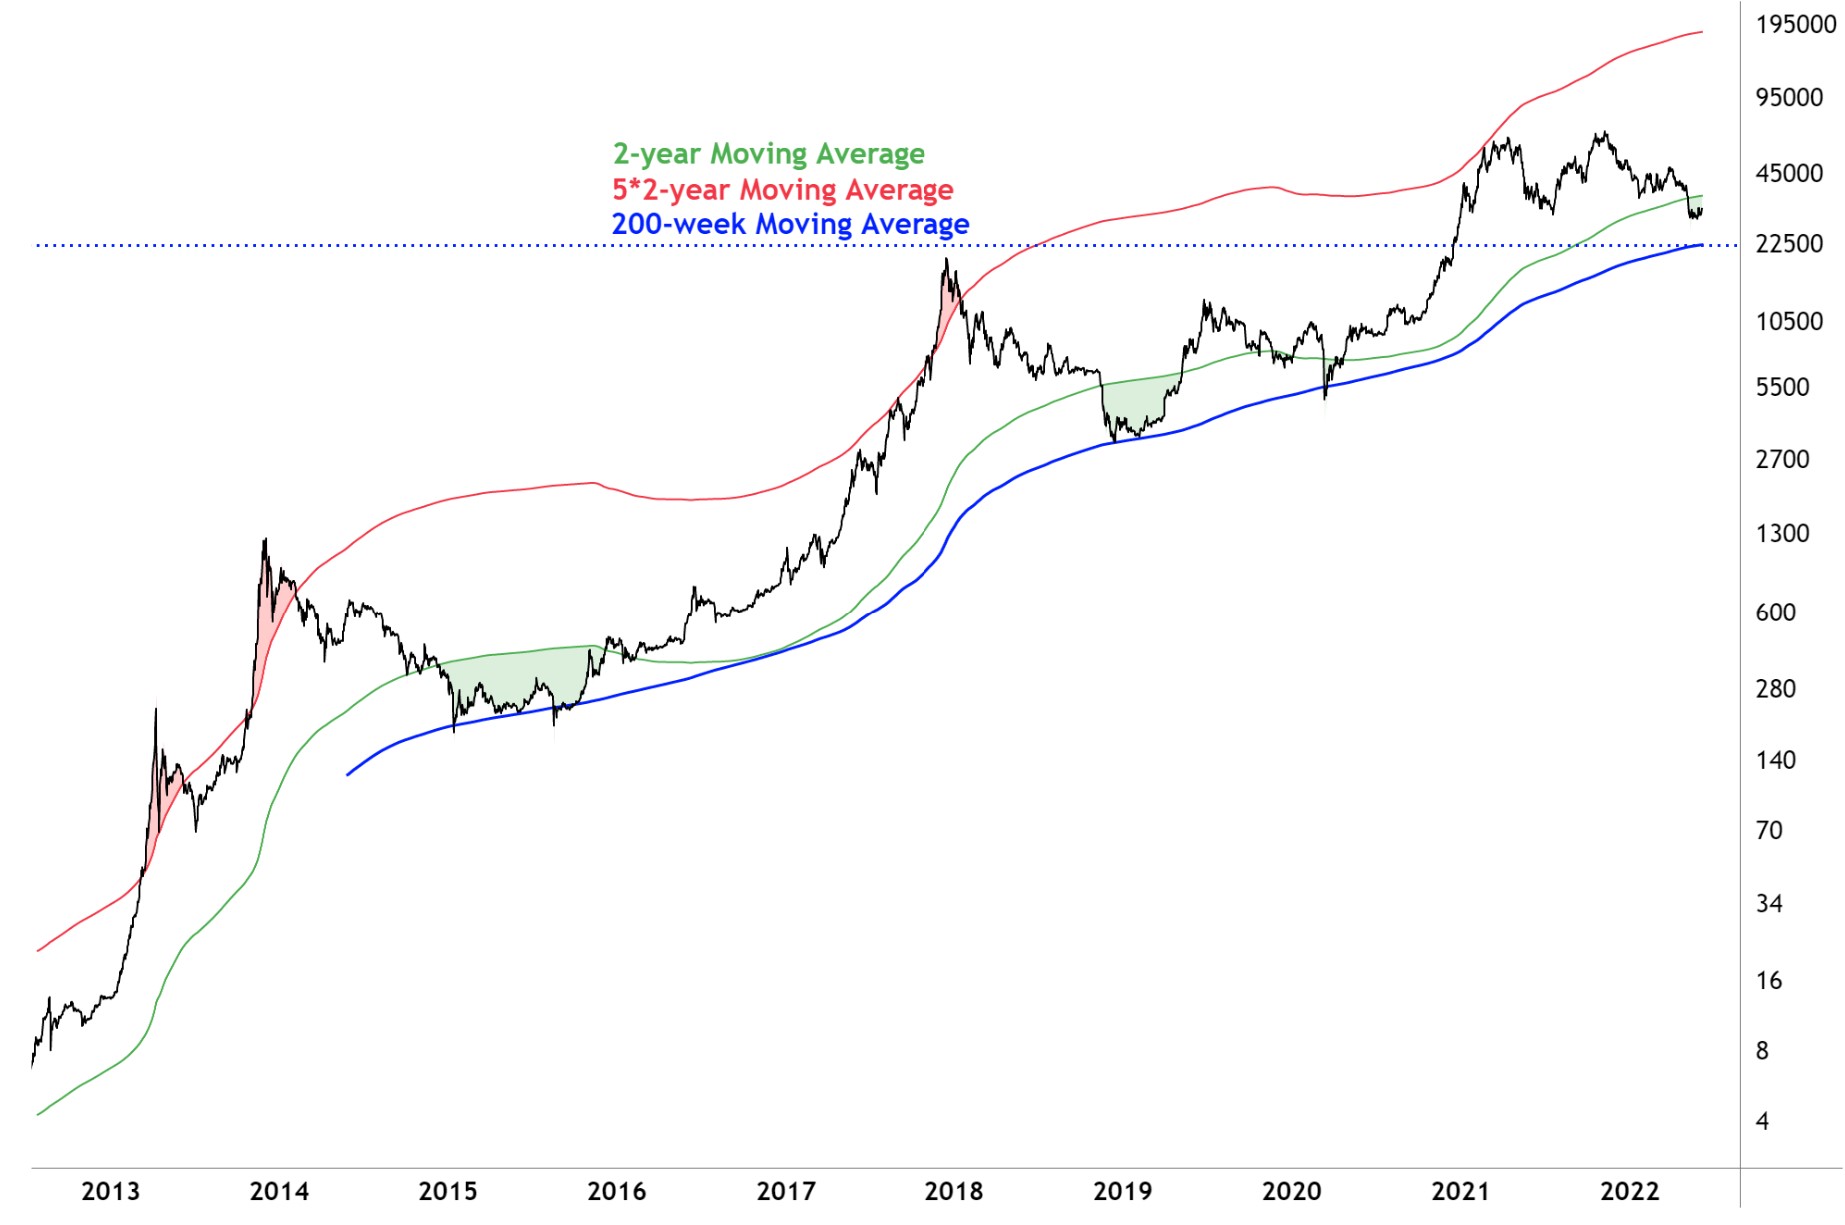
After nine straight red weekly periods, Bitcoin closed in the green last week. For those with an inclination towards candlestick patterns, the weekly candle also closed as an inverted hammer, or potential bullish reversal. On a technical basis, this trend reversal possibility increases if the current weekly candle closes above last week’s candle wick at $32,400. Zooming out though, technicals remain broadly bearish, with prices below both the 20-week moving average and the 200-day moving average. The current price zone, between the 2-year moving average and 200-week moving average has been a sensitive price level, historically marking oversold conditions. Other than March 2020, price bottoms have formed in this area over the course of multiple months, suggestive of bearish exhaustion and gradual accumulation. Also of note, sentiment analysis continues to hold at relative lows.
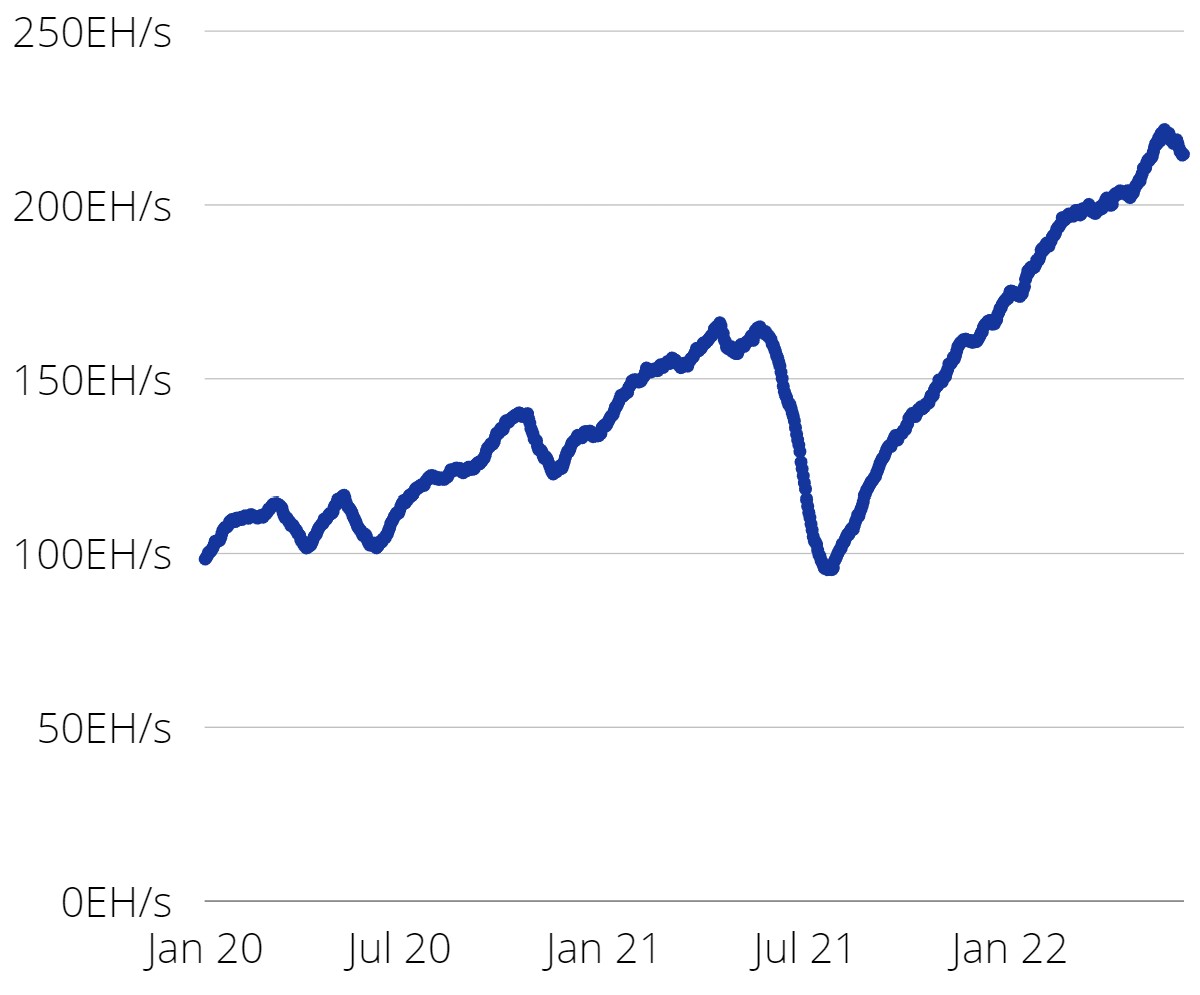
Bitcoin’s monthly average hash rate has begun to decline, with miner’s net balances showing continuous outflows over the past month. Collectively, this suggests miners are near the equilibrium of profits to costs, otherwise known as breakeven levels. Although many variables determine mining profitability, including Bitcoin price, network difficulty, block reward, and transaction fees, the least cost-efficient miners are the most likely to begin shutting down machines before those with cheaper operating costs.
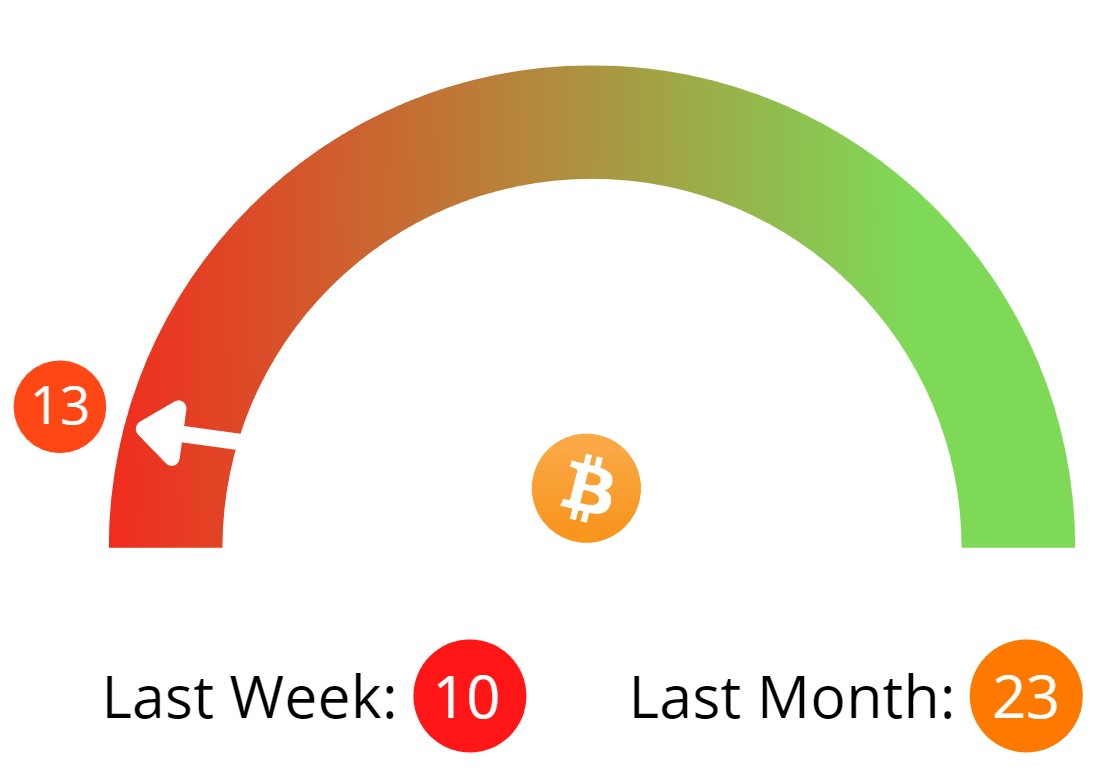
Bitcoin Fear and Greed Index
Multifactorial Market Sentiment Analysis
Bitcoin Monthly Average Hashrate
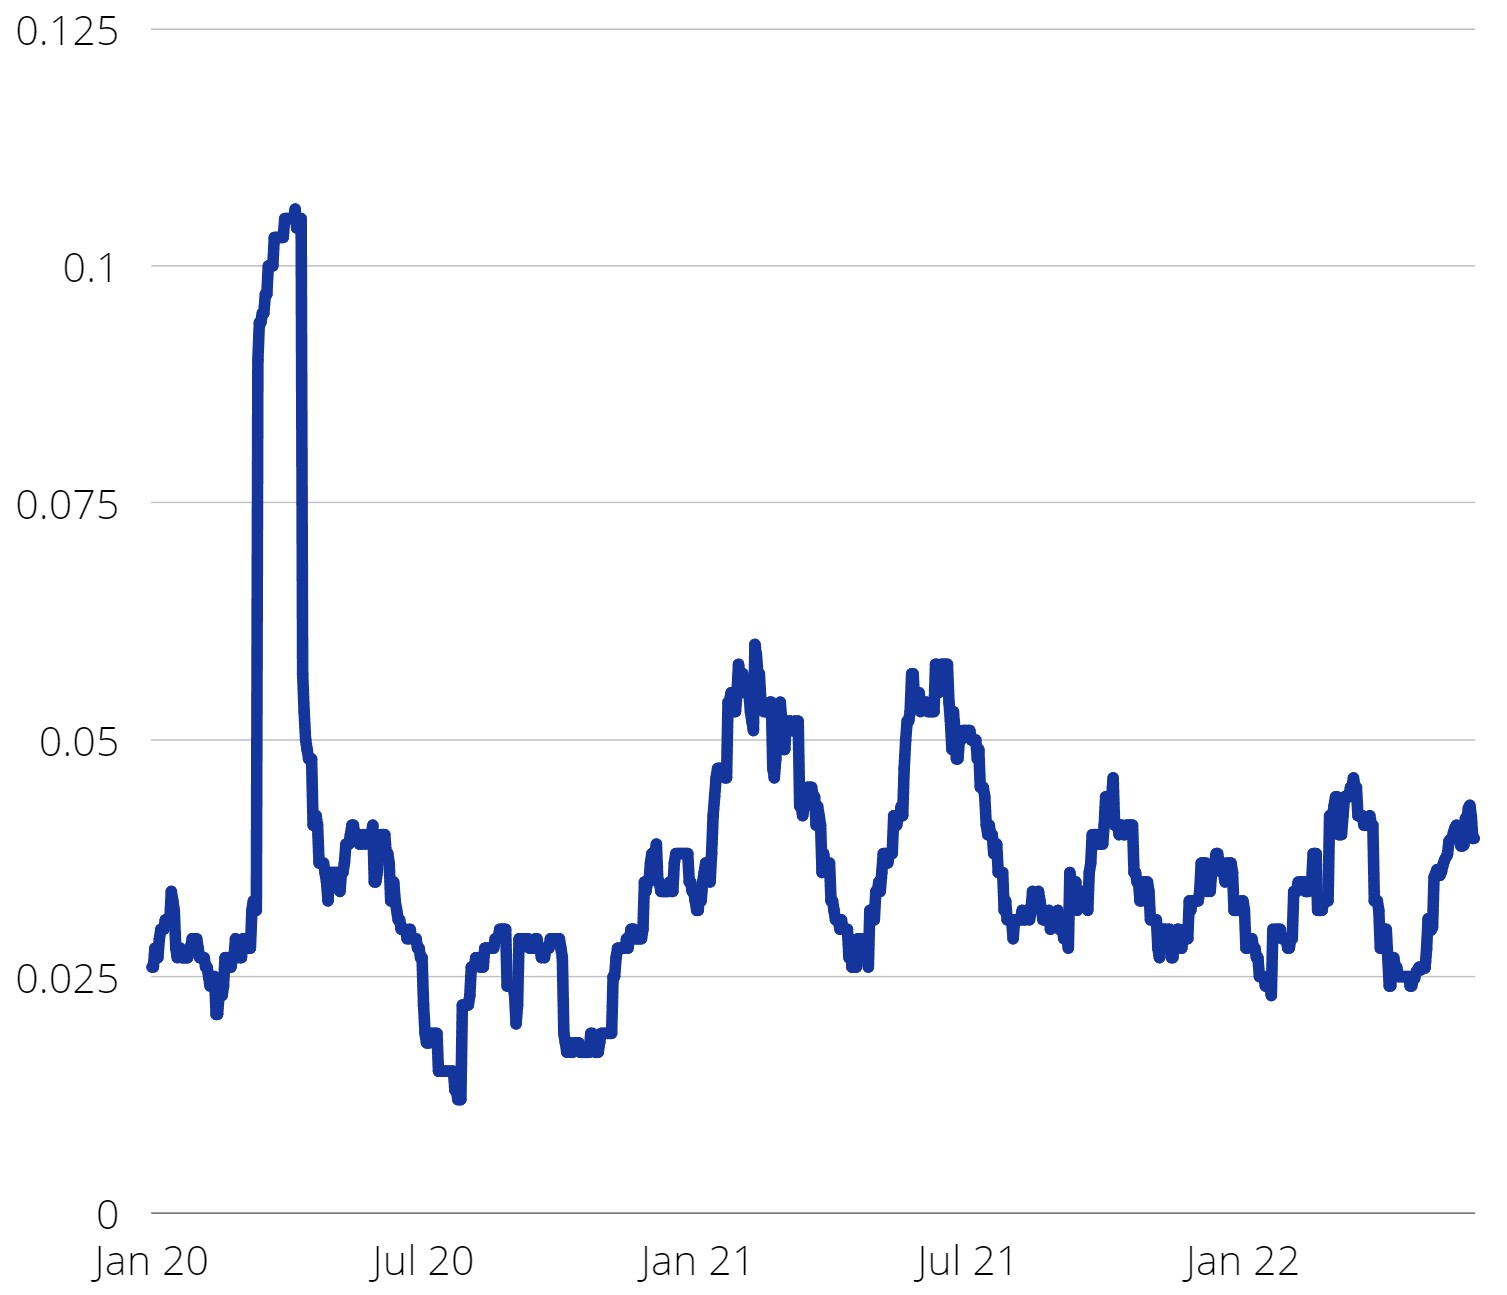
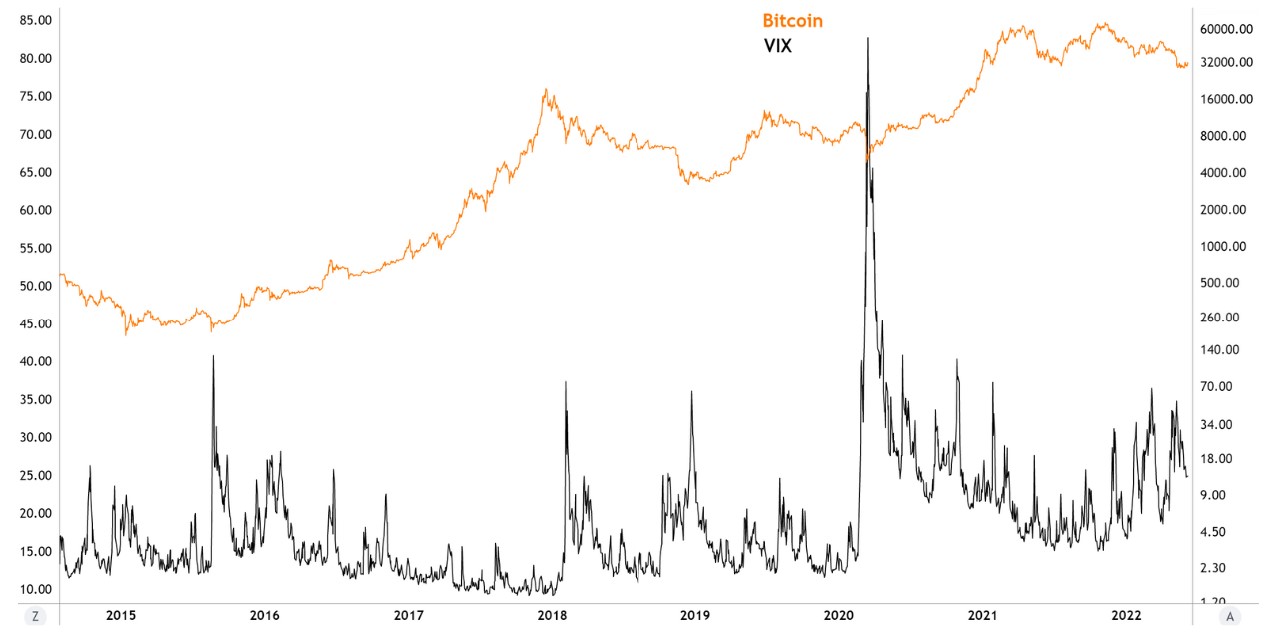
Bitcoin 30-Day Rolling Volatility
Bitcoin Moving Averages
Macro Commentary
Key Takeaways
- A 50 basis point interest rate hike is expected at the next FOMC meeting
- Jobs numbers show low unemployment as tech sector eases hiring
- Volatility is likely to continue with supply turbulence in commodities
The shortened holiday week allowed investors a moment to digest a good amount of data, which is also helping the Fed decide directionality for taming inflation over the next several months. The FOMC will meet next week for two days and are expected to raise interest rates by 50 basis points. The next meeting will follow at the end of July before a break in August. Another 50 basis points is expected during the July meeting. Initial jobless claims improved to 200k from 210k last week, still at historical lows. Friday's monthly unemployment rate was unchanged at 3.6%, in addition to non-farm payrolls at 390k, higher than surveyed but still down from 428k last month. The mixed story here is the service industry still looking to fill positions, while the tech related sector, so far, is toning down hiring for now on lower growth expectations.
CPI will be released this Friday and is expected to lower slightly to 8.2% YoY, from 8.3% last month. Core CPI, excluding food and energy, also expected to decline to 5.9% YoY, from 6.2%. Investors will be focusing on month over month CPI with the current survey coming in higher at 0.7%, from 0.3% last month. Another mixed signal with Core MoM CPI surveyed to come in slightly lower at 0.5%, from 0.6% last month.
The Ukrainian-Russian war reached the 100 day mark with no viable solutions in sight, challenging investors on next steps with more volatility expected in the near term. The S&P 500 index was range bound last week within 100 points, finishing the week down about 1%. The 10 year treasury yield rose over the week from about 2.75% to 2.95%, eclipsing the 3% level Monday morning. Crude oil futures experienced some notable moves after starting the week close to $125 then declining to almost $112 before settling close to $120 for the weekend. OPEC decided last week to boost output in the coming months. Unfortunately, Saudi Arabia increased their selling prices which brought pessimism to the market and futures prices rose.
News Review
- Eurovision Winners Kalush Orchestra Raise Nearly $1 Million in Ethereum for Ukraine
- The Investor's Podcast Network - Bitcoin Energy Revolution with Shaun Connell
- Kenya’s Largest Power Provider To Offer Geothermal Energy To Bitcoin Miners
- Denver-based Crusoe Energy Opens Crypto Mining Facility in Middle East to Use Stranded Natural Gas
- New York State Legislature Passes Bill Limiting Future Use of Carbon-Based Power Sources for Bitcoin Mining
- US Senators Lummis and Gillibrand Set to Propose Crypto Oversight Bill Next Month
- Binance To Tighten KYC and Sanctions Screening To Address Exchange’s ‘Risk’
- Japan’s Second Largest Bank to Launch Institutional Bitcoin, Crypto Custodial Services
- Japan Approves Stablecoin Law Guaranteeing Protection For Crypto Investors
- Digital Dollar Could Coexist With Stablecoins, Fed Vice Chairwoman Says
- Stablecoin Issuer Tether Enters Latin America With Mexican Peso-Pegged Stablecoin and Launches USDT Token on Polygon
- Ex-Deutsche Telecom Team Launch Liquid Staking Division at Crypto Custodian Finoa
- NFL Taps NFT Gaming Studio Mythical Games for First Play-to-Earn Venture
Stablecoin Origins & Purpose
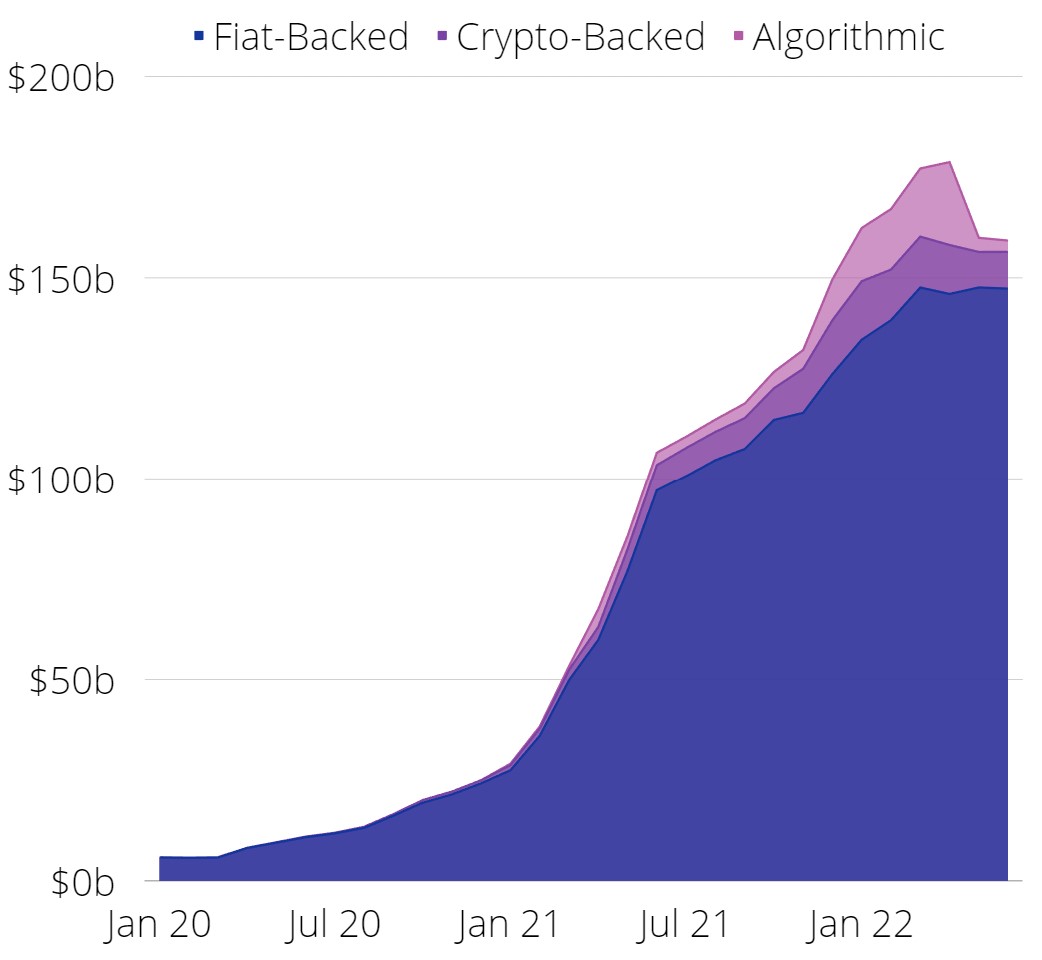
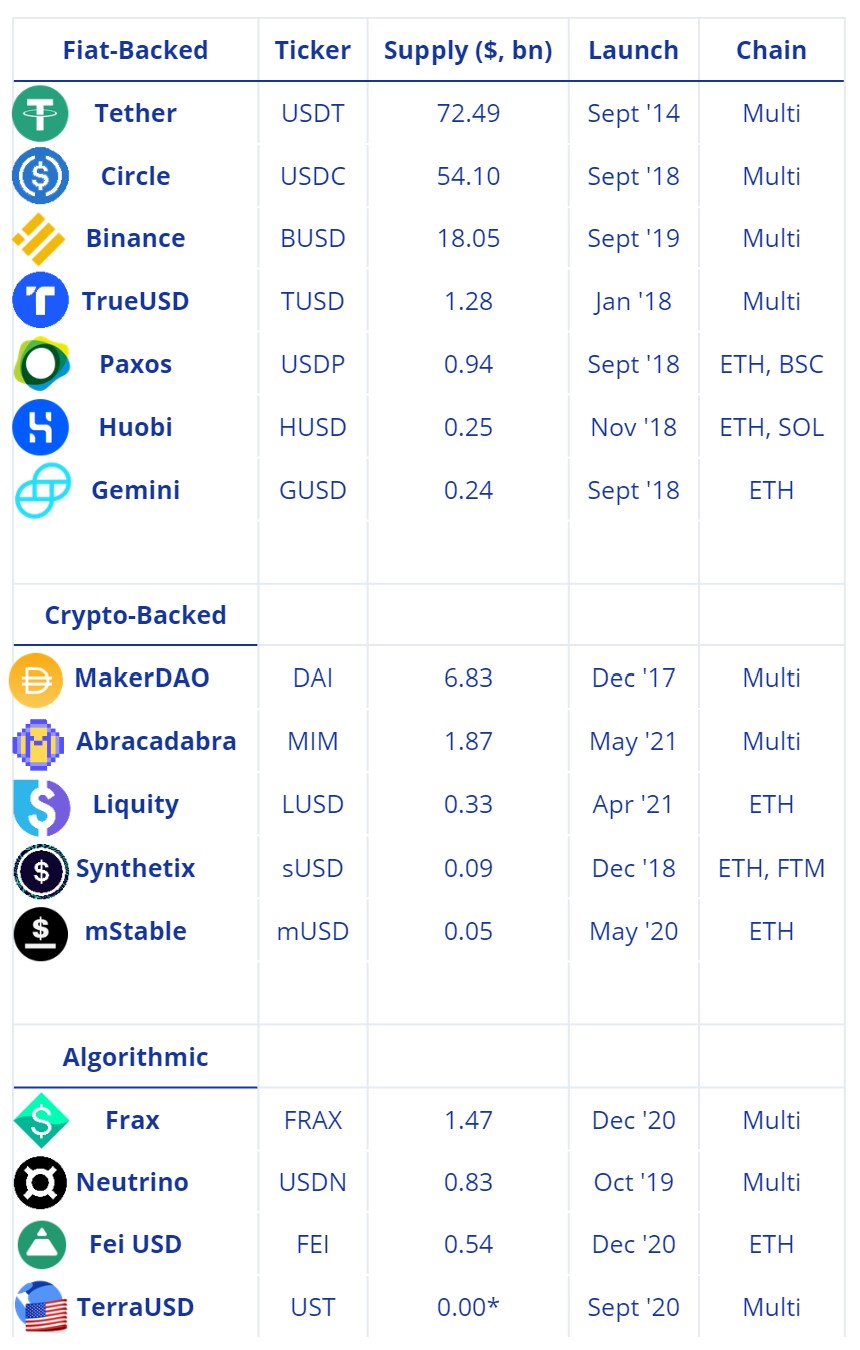
Stablecoins are a sector of cryptocurrencies which attempt to peg value to $1, typically using an external reference, such as USD or EUR. The main types of stablecoins include; fiat-backed, crypto-backed, algorithmic, or hybrid collateralization.
Tether (USDT) was initially created in 2014 to act as a potential hedge against market volatility, as well as increasing the transferability and convertibility of fiat currencies to cryptocurrencies. Tether’s usage and supply grew substantially throughout the 2017 Bitcoin bull run, which significantly increased adoption of USDT trading pairs on crypto exchanges. As scrutiny increased over Tether’s reserves, competing projects like Circle’s USD Coin (USDC) arose with a focus on increased transparency. Today, most fiat-backed stablecoins, including Tether, release monthly reserve attestations.
Fiat-Backed
The two largest stablecoins by circulating supply, USDT and USDC, are both backed by USD reserves and/or USD equivalents held in third-party financial institutions. Issuing these types of stablecoins directly from the servicer also requires KYC/AML compliance and minimum capital requirements.
Crypto-Backed
Crypto-collateralized stablecoins require on-chain management with the use of smart contracts, which also allows for 100% transparency of reserves and collateralization levels. Most crypto-backed stablecoins do not have KYC/AML or minimum capital requirements for initialization but do require overcollaterization of loans to buffer against market volatility. If these loans fall below the required collaterization level, they are liquidated.
Algorithmic
Of all stablecoin types, algorithmic or seigniorage-style stablecoins have had the most difficulty maintaining a $1 peg, historically. This stablecoin type does not require collateral and are managed on-chain via smart contracts. Algorithmic stablecoins will increase or decrease the circulating supply to maintain stablecoin value.
Terra and UST De-pegging Event
In early May, as digital asset prices turned increasingly bearish, the UST $1 peg for Terra’s algorithmic stablecoin began to slip below $1. Theoretically, in this scenario, UST is burned (sent to an irretrievable address) and LUNA is minted in order to correct the UST target price of $1. The Terra and UST ecosystem had minted nearly 20 billion tokens over the past few months, in large part due to the 20% APY incentives on Terra’s lending and borrowing platform, Anchor Protocol. As destabilization of the equilibrium began, UST selling pressure far outpaced the ability of Terra to course correct the peg price. Terra had prepared for this possibility occurring and had acquired over $3 billion in a mixture of USDC, USDT, Bitcoin, and Avalanche in recent weeks to act as an additional backstop in the event of a de-pegging death spiral. Unfortunately, even these reserves were unable to hold UST near the $1 price as a greater amount of UST was exiting the ecosystem while the Terra price was also decreasing.
Stablecoin Circulating Supply
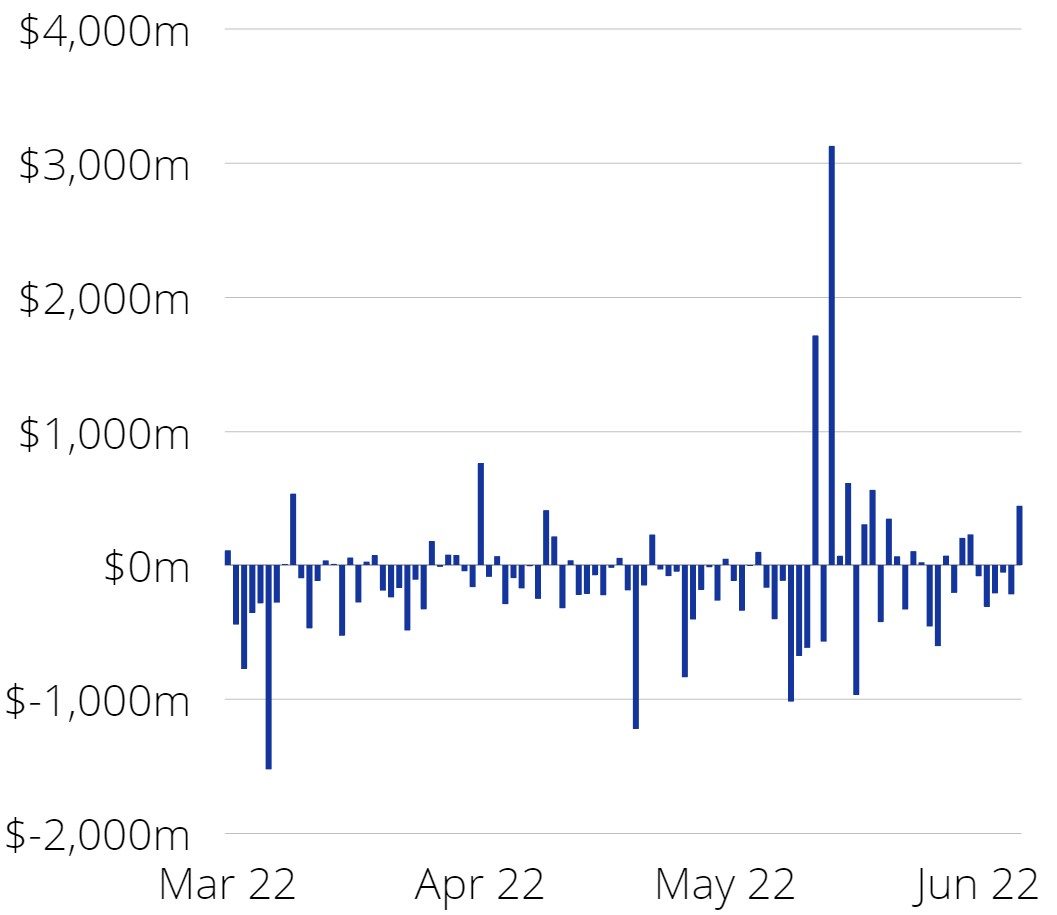
Stablecoin Net Exchange Flow
The Portfolio Management Team
Steven McClurg, CIO
Bill Cannon, Portfolio Manager
Wes Cowan, Portfolio Manager, Head of Defi
Josh Olszewicz, Head of Research
Sean Rooney, VP Research and Trading
Will McDonough, Vice Chairman, Investment Committee
Leah Wald, CEO, Investment Committee
Shannon Smith, Head of Investor Relations
Weekly Thoughts: Source: Valkyrie Investments, Inc.
Stablecoin Origins & Purpose, Fiat-Backed, Crypto-Backed, Algorithmic, Terra and UST De-pegging Event: Valkyrie Investments, Inc., Tether Operations, CoinMetrics, Circle, and Paxos
Macro Commentary: Source: Valkyrie Investments, Inc.
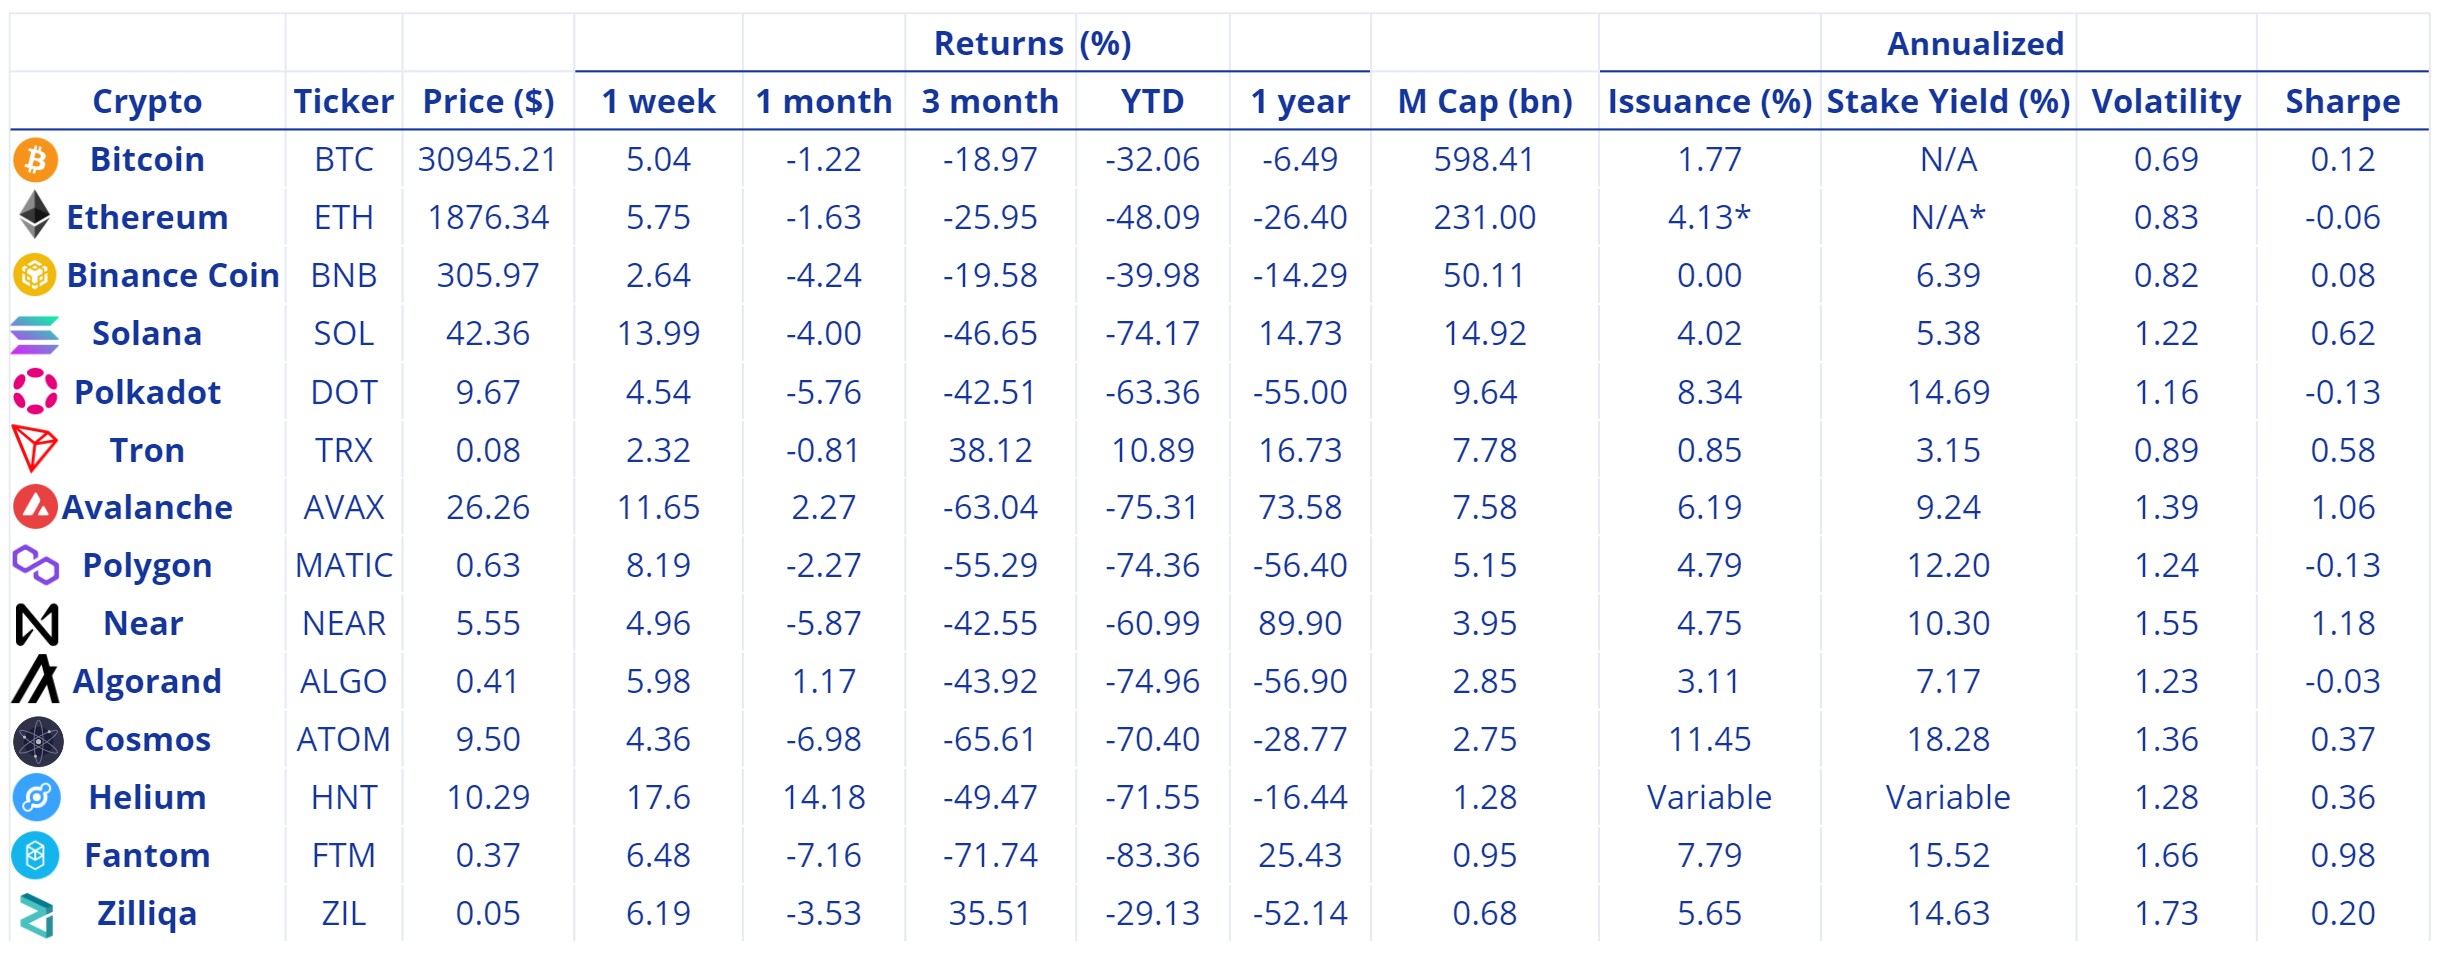
Coin Prices, Market Capitalizations, and Returns: Source: Valkyrie Investments, Inc., TradingView, Messari. All returns represent total return for stated period. Coin Logos: Source: cryptologos.cc
Annualized Issuance, Staking Yield, Volatility, and Sharpe Ratio: Source: Valkyrie Investments, Inc., Messari, StakingRewards.com. *ETH's EIP-1559 token burn and ETH-2 staking not included.
Bitcoin Fear and Greed Index Source: Valkyrie Investments, Inc., alternative.me and represents a multifactorial sentiment analysis index of volatility, market momentum and volume, social media, bitcoin market cap dominance, and Google trends
Bitcoin Monthly Average Hashrate, Bitcoin 30-Day Rolling Volatility: Source: Valkyrie Investments, Inc., CoinMetrics
Bitcoin Weekly Moving Averages: Source: Valkyrie Investments, Inc., TradingView - INDEX:BTCUSD
Stablecoin Circulating Supply: Source: Valkyrie Investments, CoinMetrics, The Block, and CoinGecko
Stablecoin Net Exchange Flow: Source: Valkyrie Investments, Inc., Nansen and represent wallet inflows and outflows of Tether, USD Coin, Binance USD, PAX, and Huobi USD through crypto exchanges, including but not limited to; Binance, Curve.fi, AnySwap, Crypto.com, Uniswap, Hop Protocol, OKEx, Kucoin, dYdX, Coinbase, Kraken, Huobi, FTX, Gemini, FTX US, CoinList, SushiSwap, Gate.io, Balancer, BitMEX, Bitfinex, Bittrex, Binance US, Bitstamp, BlockFi, Paxos, Celsius, Alameda OTC, Poloniex, HitBTC, Bancor, Kyber, and ShibaSwap.
List and examples shown in the Stablecoin table are non-exhaustive, intended for illustrative purposes only. Chain data sourced from CoinMarketCap. "Multi" description can include Ethereum, Solana, Binance Smart Chain, Algorand, Tron, Fantom, Polygon, Avalanche, Arbitrum, Secret, Terra, Moonriver, Velas, and Harmony. Coin Logos: Source: cryptologos.cc
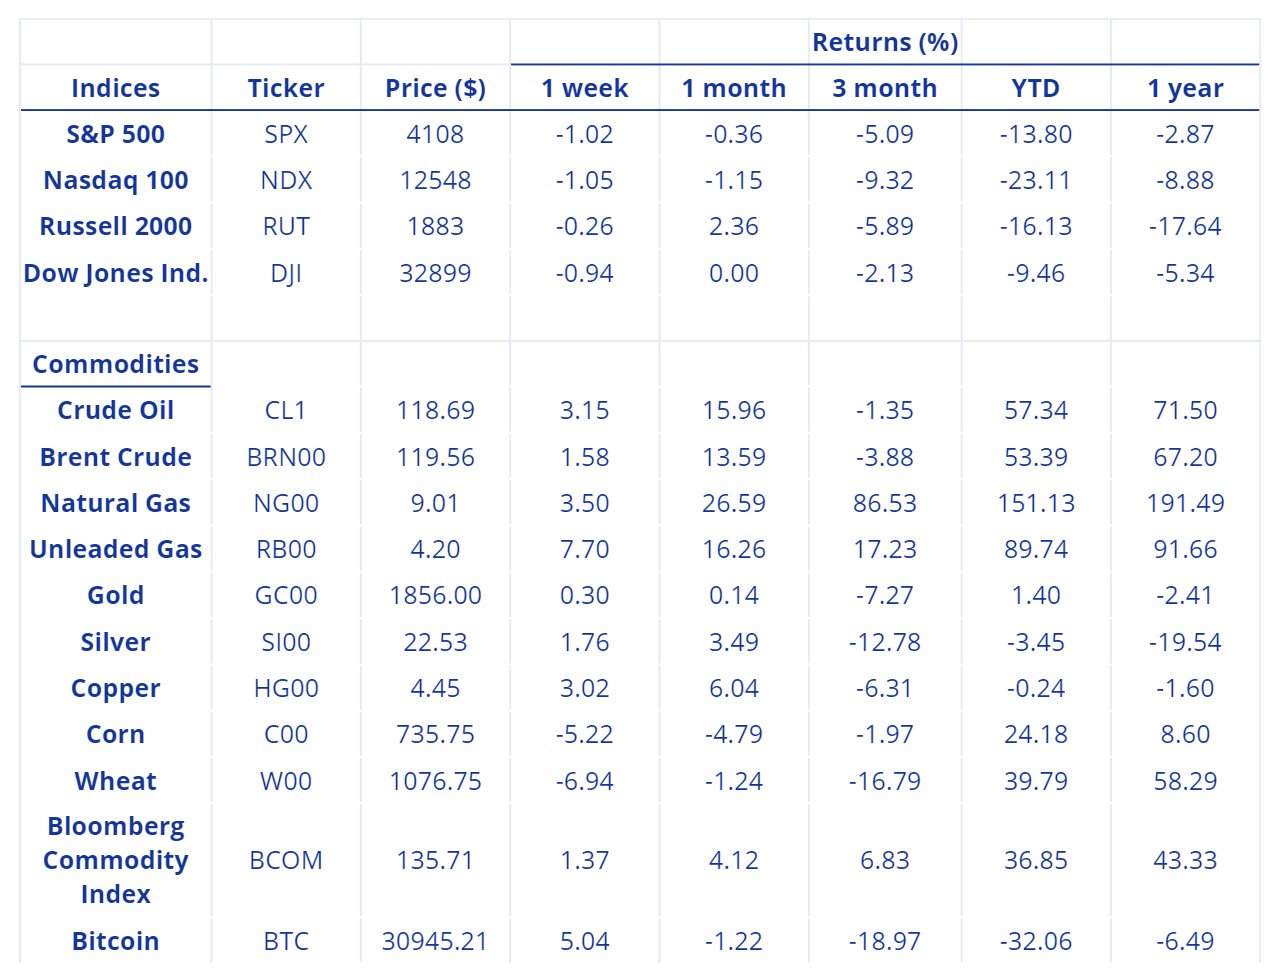
"Indicies" prices and returns: Source: Valkyrie Investments, Inc., MarketWatch. "S&P 500" provided by Standard & Poor’s and is a stock market index tracking the performance of 500 large companies listed on stock exchanges in the United States, "Nasdaq 100" provided by NASDAQ OMX Group and includes 100 of the largest domestic and international non-financial companies listed on the Nasdaq Stock Market based on market capitalization. "Russell 2000" provided by FTSE Russell and is a small-cap stock market index that makes up the smallest 2,000 stocks in the Russell 3000 Index. "Dow Jones Ind." provided by S&P Dow Jones Indices and is a price-weighted measurement stock market index of 30 prominent companies listed on stock exchanges in the United States. "Gold" provided by NYMEX - CME Group and is a continuous futures product. All returns represent total return for stated period.
"Commodities" prices and returns: Source: Valkyrie Investments, Inc., Wall Street Journal. Bloomberg Commodity Index provided by Bloomberg and tracks prices of futures contracts on physical commodities on the commodity markets. All returns represent total return for stated period.
Past performance is not indicative of future results. Investments may be speculative, illiquid and there is a risk of total loss. There is no guarantee that any specific outcome will be achieved. This is not an offer to buy or sell securities. We do not offer legal, tax or financial advice. Information is purported to be as of the time period provided therein. Charts/graphs are for illustrative purposes only.
Cautionary Statement Concerning Forward-Looking Statements:
This document contains forward-looking statements. In addition, from time to time, we or our representatives may make forward-looking statements orally or in writing. We base these forward-looking statements on our expectations and projections about future events, which we derive from the information currently available to us. Such forward-looking statements relate to future events or our future performance, including: our financial performance and projections; our growth in revenue and earnings; and our business prospects and opportunities. You can identify forward-looking statements by those that are not historical in nature, particularly those that use terminology such as “may,” “should,” “expects,” “anticipates,” “contemplates,” “estimates,” “believes,” “plans,” “projected,” “predicts,” “potential,” or “hopes” or the negative of these or similar terms. In evaluating these forward-looking statements, you should consider various factors, including: our ability to change the direction of the Company; our ability to keep pace with new technology and changing market needs; and the competitive environment of our business. These and other factors may cause our actual results to differ materially from any forward-looking statement. Forward-looking statements are only predictions. The forward-looking events discussed in this document and other statements made from time to time by us or our representatives, may not occur, and actual events and results may differ materially and are subject to risks, uncertainties and assumptions about us. We are not obligated to publicly update or revise any forward-looking statement, whether as a result of uncertainties and assumptions, the forward-looking events discussed in this document and other statements made from time to time by us or our representatives might not occur.